. 2014 Oct 9;10(10):e1004672.
doi: 10.1371/journal.pgen.1004672. eCollection 2014 Oct.

Sensors at centrosomes reveal determinants of local separase activity

Affiliations

Sensors at centrosomes reveal determinants of local separase activity

Fikret Gurkan Agircan et al. PLoS Genet. .

Abstract

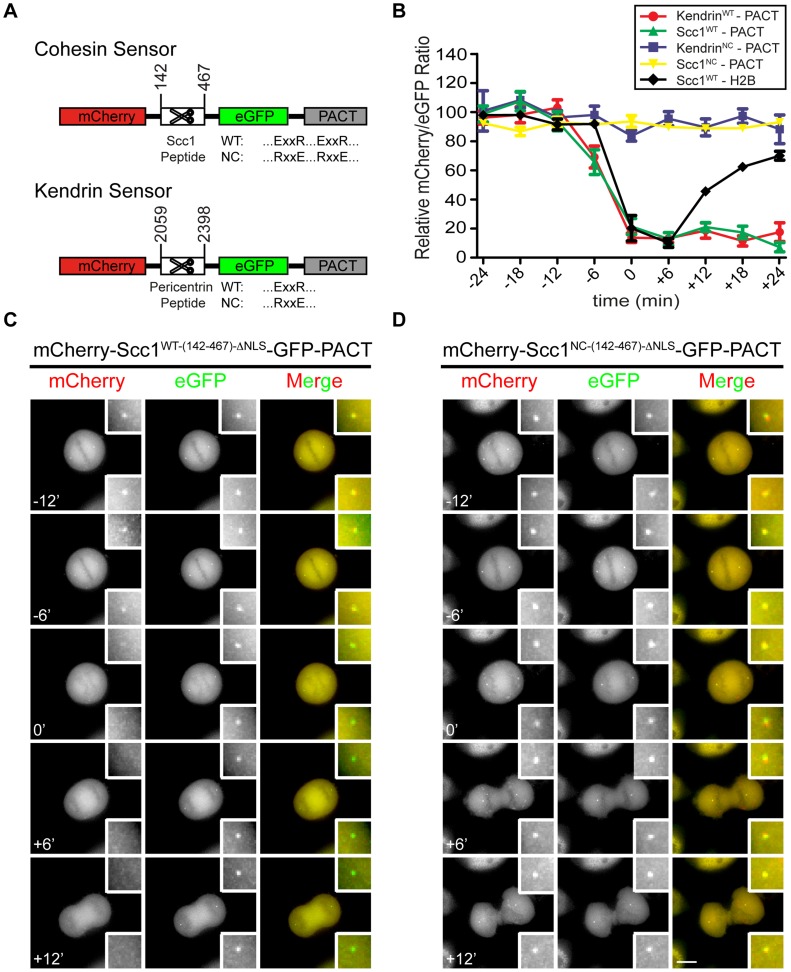
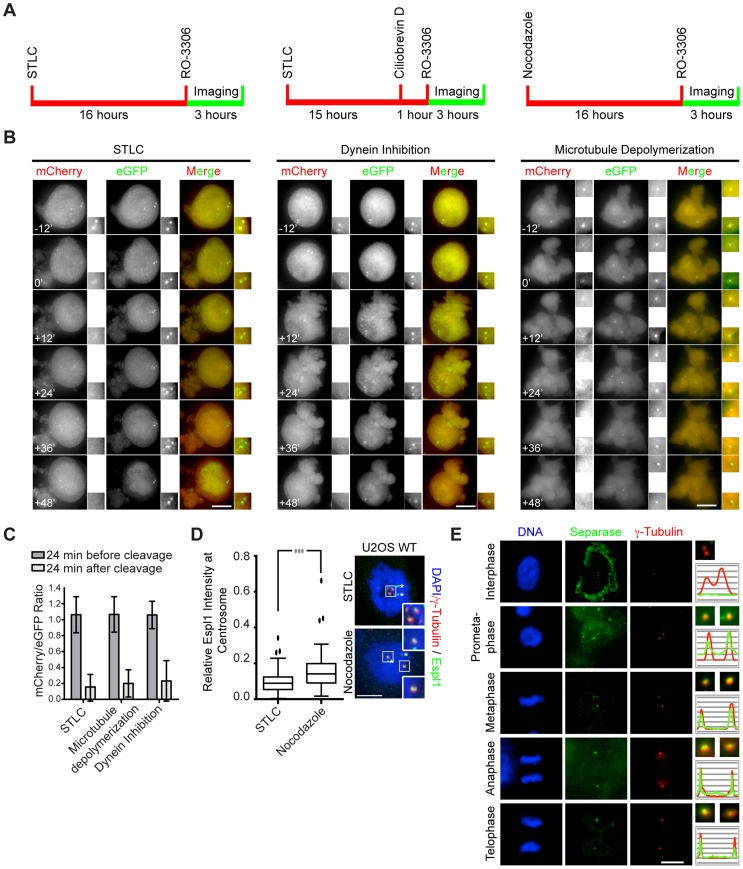
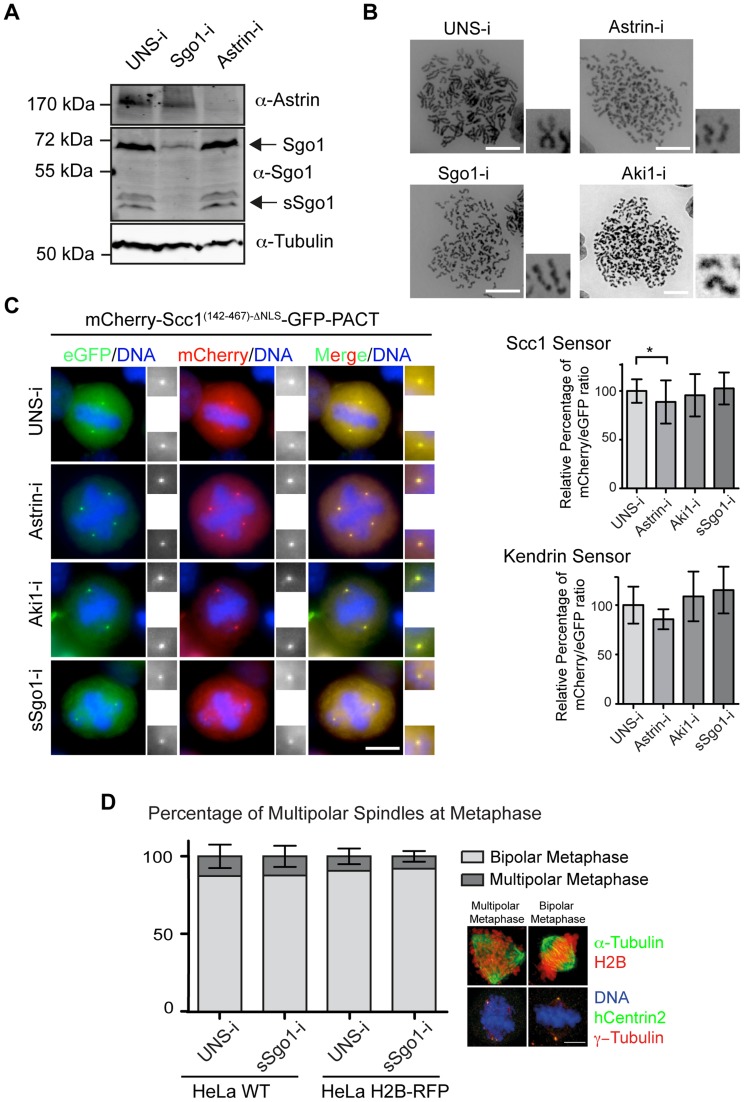
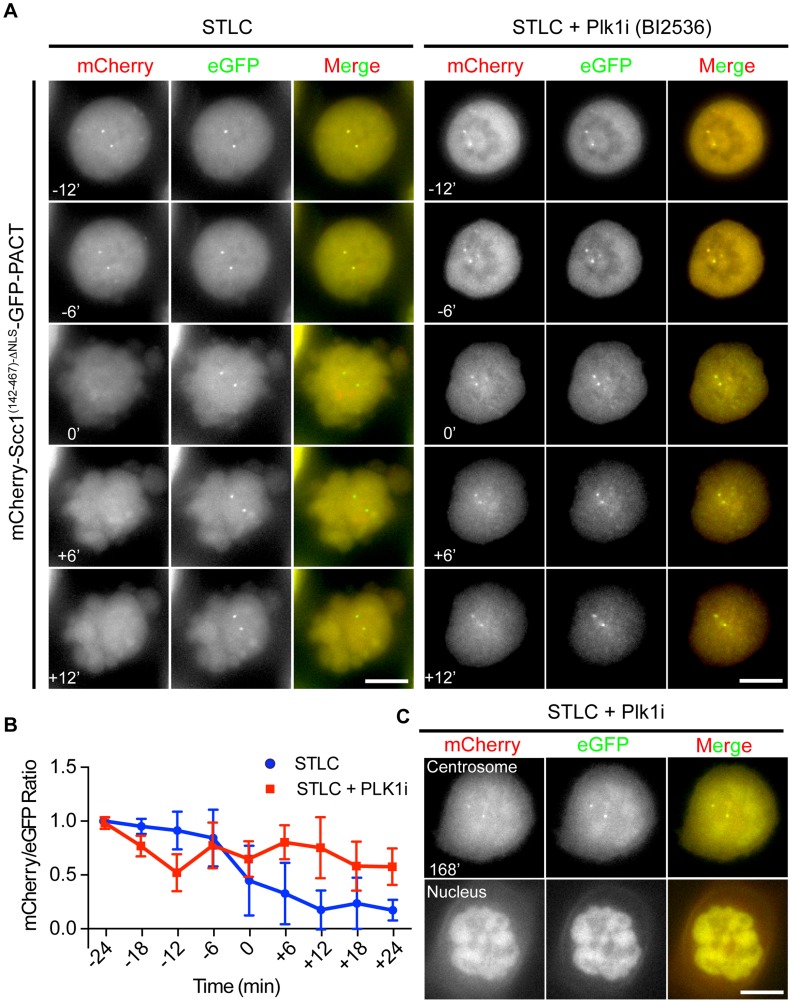
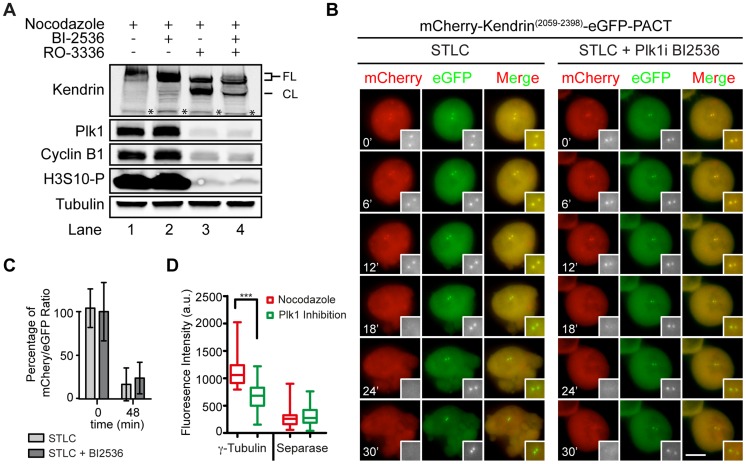
Separase is best known for its function in sister chromatid separation at the metaphase-anaphase transition. It also has a role in centriole disengagement in late mitosis/G1. To gain insight into the activity of separase at centrosomes, we developed two separase activity sensors: mCherry-Scc1(142-467)-ΔNLS-eGFP-PACT and mCherry-kendrin(2059-2398)-eGFP-PACT. Both localize to the centrosomes and enabled us to monitor local separase activity at the centrosome in real time. Both centrosomal sensors were cleaved by separase before anaphase onset, earlier than the corresponding H2B-mCherry-Scc1(142-467)-eGFP sensor at chromosomes. This indicates that substrate cleavage by separase is not synchronous in the cells. Depletion of the proteins astrin or Aki1, which have been described as inhibitors of centrosomal separase, did not led to a significant activation of separase at centrosomes, emphasizing the importance of direct separase activity measurements at the centrosomes. Inhibition of polo-like kinase Plk1, on the other hand, decreased the separase activity towards the Scc1 but not the kendrin reporter. Together these findings indicate that Plk1 regulates separase activity at the level of substrate affinity at centrosomes and may explain in part the role of Plk1 in centriole disengagement.


Conflict of interest statement

The authors have declared that no competing interests exist.

Figures

Figure 1
Figure 1. Construction of separase sensor constructs for centrosomes.
(A) The architecture of the centrosomal Scc1 and kendrin sensors. (B) Relative intensity plots of the mCherry/eGFP ratio for the following centrosomal signals: mCherry-Scc1WT-(142-467)-ΔNLS-eGFP-PACT (n = 18), mCherry-Scc1NC-(142-467)-ΔNLS-eGFP-PACT (n = 20), mCherry-KendrinWT-(2059-2398)-eGFP-PACT (n = 27), and mCherry-KendrinNC-(2059-2398)-eGFP-PACT (n = 11). In addition, H2B-mCherry-Scc1(142-467)-eGFP (n = 10) at chromatin was analyzed for separase activity; for H2B sensor, eGFP/mCherry ratio was used and plotted as described in materials and methods section. The ratio of mCherry/eGFP was normalized to the average of the first two data points (time = −24 min and −18 min) in order to assess cleavage rates. Time t = 0 indicates anaphase onset. The error bars are SEM. (C, D) The mCherry-Scc1WT-(142-467)-ΔNLS-eGFP-PACT (C) and mCherry-Scc1NC-(142-467)-ΔNLS-eGFP-PACT (D) sensors stably integrated into the FRT locus of HeLa T-REx cells were followed every 6 min. Time t = 0 min indicates anaphase onset. Representative images are shown. Insets show the two-fold enlarged centrosomal signals. Scale bar: 10 µm.
Figure 2
Figure 2. Separase localizes to centrosomes in a microtubule-independent manner.
(A) Cells were arrested at prometaphase with either 5 µM of STLC or 0.1 µg/ml of nocodazole. To inhibit dynein, STLC arrested cells (15 h) were treated for 1 h with 50 µM of cytoplasmic dynein inhibitor Ciliobrevin D. All cells were then treated with 4 µM of the Cdk1 inhibitor RO-3306 to force mitotic exit. Cells were imaged every 6 min for sensor cleavage. (B) Representative images showing separase activity in the presence of the Eg5 inhibitor STLC, dynein inhibitor Ciliobrevin D or the microtubule poison nocodazole. Time t = 0 min reflects initiation of mitotic exit, which was judged upon the cleavage of the sensor and a sudden shift in focus that arises from cell spreading at the end of mitosis. Insets show the two-fold enlarged centrosomal images. Scale bar: 10 µm. (C) The mCherry/eGFP ratio of (B) as measured 24 min before and after cleavage (t = 0 min), and normalized to the initial ratio (t = −24 min). Error bars represent S.D. n = 20. (D) Quantification of separase signal at the centrosome after normalization to the centrosomal γ–tubulin signal. The relative Espl1 intensity was plotted using Graphpad 6 with Whisker-Box Plot. n = 98 (nocodazole), n = 70 (STLC) (error bars = SD, *** represents p<0.001). Separase signal at centrosomes does not decrease upon depolymerization of microtubules. The asterisks show unavoidable antibody background. Insets show the two-fold enlarged images of the boxed area in the main image. (E) Localization of separase at centrosomes during mitosis. Indirect immunofluorescence with anti-separase antibody was performed. γ-tubulin was used as centrosomal marker. Two-fold enlargements of the centrosomes are depicted on the right. The distribution of the green separase and the red γ-tubulin signals are presented as line scans. Scale bar: 10 µm.
Figure 3
Figure 3. Astrin (Spag5), Aki1 and Sgo1 depletion does not promote centriole disengagement.
(A) Immunoblot analysis of HeLa cells following astrin and sSgo1/Sgo1 depletion. α-Tubulin was used as loading control. (B) Depletions of Sgo1, astrin or Aki1 caused premature loss of sister chromatid cohesin. Chromosome spreads of HeLa cells are shown. Four fold enlargements on the right show the separated sister chromatids. Scale bar: 10 µm. (C) Representative images of HeLa cells stably expressing the Scc1 and kendrin sensors upon depletion of Sgo1, astrin or Aki1. The two-fold enlargements show the centrosomes. The relative mCherry/eGFP ratios upon siRNA treatment of cells are depicted on the right for the Scc1 (n>45) and kendrin (n>15) sensors. One-way ANOVA was used as statistical test (* represents p<0.05). Error bars are SD. Scale bar: 10 µm. (D) The percentages of multipolar spindles did not change in response to Sgo1 depletion in HeLa WT and HeLa H2B-RFP cells. The images on the right indicate examples of cells with multipolar and bipolar metaphase spindles. Scale bar: 10 µm. n = 30. Error bars indicate SD.
Figure 4
Figure 4. Plk1 is important for cleavage of the Scc1 sensor.
(A) HeLa cells were incubated with 5 µM STLC and with or without 100 nM BI2536 for 1 h. Cells were driven out of mitosis with 4 µM of Cdk1 inhibitor RO-3306 in order to observe the activity of separase. Single Z-plane images were depicted. Size bars: 10 µm. (B) Quantification of (A). Separase activity decreases by 50% upon Plk1 inhibition although the cells exited mitosis. n≥10. Error bars represent SD. (C) Chromosome condensation of cells from (A) after 168 min incubation with Cdk1 inhibitor. Upper panel shows the Z-plane where the centrosomes were in focus, and the lower plane shows the Z-plane where the nucleus was in focus. Note that a fraction of the mCherry-Scc1(142-467)-ΔNLS-GFP-PACT sensor accumulates inside the nucleus. Scale bar: 10 µm.
Figure 5
Figure 5. Plk1 regulates substrate cleavage of Scc1 but neither the activity of separase nor the cleavage of kendrin.
(A) The level of cyclin B1 and cleaved kendrin do not change upon Plk1 inhibition. FL indicates the non-cleaved kendrin and CL the cleaved kendrin product. The asterisk indicates protein bands that are unspecifically recognized by the anti-kendrin antibody. (B) mCherry-Kendrin(2059-2398)-eGFP-PACT stably expressing HeLa cells were analyzed for the cleavage of the sensor upon Plk1 inhibition. Experiment was performed as described in Figure 4A. The two-fold magnifications on the bottom right of the figures highlights the centrosomes. The scale bar represents 10 µm. (C) The quantification of (B). mCherry/eGFP ratio at centrosomes was quantified just after (t = 0) and 48 min after (t = 48) addition of the Plk1 inhibitor BI2536. Data were normalized to the average mCherry to eGFP ratio at t = 0 min. (D) The levels of γ-tubulin and Espl1 signals at the centrosome were plotted using Whisker-Box plot after Plk1 (BI2536) inhibition. The level of Espl1 did not change upon Plk1 inhibition although the γ-tubulin signal declined compared to nocodazole treatment as a control to maintain the cells at prometaphase. Statistical analysis was performed with one-way ANOVA (*** represents p<0.001). N≥30, Error bars: SD.

References

    1. Paintrand M, Moudjou M, Delacroix H, Bornens M (1992) Centrosome organization and centriole architecture: their sensitivity to divalent cations. J Struct Biol 108: 107–128. - PubMed
    1. Piel M, Meyer P, Khodjakov A, Rieder CL, Bornens M (2000) The respective contributions of the mother and daughter centrioles to centrosome activity and behavior in vertebrate cells. J Cell Biol 149: 317–330. - PMC - PubMed
    1. Tsou MF, Stearns T (2006) Mechanism limiting centrosome duplication to once per cell cycle. Nature 442: 947–951. - PubMed
    1. Wang WJ, Soni RK, Uryu K, Tsou MF (2011) The conversion of centrioles to centrosomes: essential coupling of duplication with segregation. J Cell Biol 193: 727–739. - PMC - PubMed
    1. Fang G, Zhang D, Yin H, Zheng L, Bi X, et al. (2014) Centlein mediates an interaction between C-Nap1 and Cep68 to maintain centrosome cohesion. J Cell Sci 127: 1631–1639. - PubMed

Publication types

MeSH terms

LinkOut - more resources