. 2014 Nov 10;42(20):12380-7.
doi: 10.1093/nar/gku923. Epub 2014 Oct 9.

Profiling the transcription factor regulatory networks of human cell types

Affiliations

Profiling the transcription factor regulatory networks of human cell types

Shihua Zhang et al. Nucleic Acids Res. .

Abstract

Neph et al. (2012) (Circuitry and dynamics of human transcription factor regulatory networks. Cell, 150: 1274-1286) reported the transcription factor (TF) regulatory networks of 41 human cell types using the DNaseI footprinting technique. This provides a valuable resource for uncovering regulation principles in different human cells. In this paper, the architectures of the 41 regulatory networks and the distributions of housekeeping and specific regulatory interactions are investigated. The TF regulatory networks of different human cell types demonstrate similar global three-layer (top, core and bottom) hierarchical architectures, which are greatly different from the yeast TF regulatory network. However, they have distinguishable local organizations, as suggested by the fact that wiring patterns of only a few TFs are enough to distinguish cell identities. The TF regulatory network of human embryonic stem cells (hESCs) is dense and enriched with interactions that are unseen in the networks of other cell types. The examination of specific regulatory interactions suggests that specific interactions play important roles in hESCs.


Figures

Figure 1.
Figure 1.
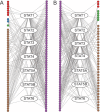
The hierarchical clustering of 41 cell types, where the color indicates which classes they belong to (Methods). (A) The clustering reported in (18) and redrawn for the purpose of comparison, which is based on the pairwise Euclidean distances between the NND vectors of the corresponding TF regulatory networks, has RI = 0.801. (B) Our clustering, which is based on the distribution of the downstream targets of the seven signal transducer and activator of transcription (STAT) proteins, has RI = 0.856.
Figure 2.
Figure 2.
The STATs and their downstream regulatory targets in hESCs (A) and HSCs (B). Purple TFs are those regulated by some STATs in both cell types. The cell fate commitment process (GO:0045165) is enriched in the targets of STATs in hESCs (Benjamini corrected P-value = 2.72e−7). Dark red and blue targets are the TFs annotated with the GO term. The hemopoietic or lymphoid organ development process (GO:0048534) is enriched in the targets of STATs in HSCs (Benjamini corrected P-value = 0.03). Green and blue targets are the TFs annotated with this GO term. Brown targets are other targets whose GO annotations are not given.
Figure 3.
Figure 3.
(A) A schematic view of the three-layer hierarchical structure of the hESC TF regulatory network. The links between the top and bottom layers are colored yellow. (B) A summary of average percentages of nodes (dark red) in the three layers and of links (blue) within and across the top, core and bottom layers in a human cell-type TF regulatory network.
Figure 4.
Figure 4.
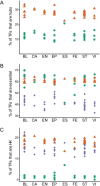
Percentages of TFs that are hubs (A), essential (B) and HK (C) in the top (green circle), core (brown triangle) and bottom (blue diamond) layers in 41 human cell-type TF regulatory networks, grouped according to cell class. Abbreviations: BL, blood; CA, cancer; EN, endothelia; EP, epithelia; ES, ESC; FE, fetal; ST, stromal cells; VI, visceral cells.
Figure 5.
Figure 5.
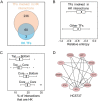
(A) The intersection of the subset of TFs that are involved in HK interactions and the subset of TFs that are encoded by HK genes. (B) The box plots of the relative entropy of the expression values of the genes encoding TFs involved in HK interactions (above) and other TFs (below). (C) The box plots of the proportions of HK interactions within the core layer and among the top, core and bottom layers in the 41 human cell-type TF regulatory networks. (D) TFs and HK interactions among them in a protein complex (id: HC5737) (24).
Figure 6.
Figure 6.
(A) Proportions of hub TFs that are in Assou et al.'s list (36) and the significance of their enrichment in the ESCSN. (B) The subnetwork induced by the hub TFs in the Assou et al.'s list in the ESCSN. (C) Proportions of known hESC interactions (38) and the significance of their enrichment in the ESCSN. (D) The hESC-specific regulatory interactions appearing in a reported core transcription network for hESCs (38). (E) and (F) Two specific regulatory complex-target modules in the hESCs.

References

    1. Ravasi T., Suzuki H., Cannistraci C.V., Katayama S., Bajic V.B., Tan K., Akalin A., Schmeier S., Kanamori-Katayama M., Bertin N., et al. An atlas of combinatorial transcriptional regulation in mouse and man. Cell. 2010;140:744–752. - PMC - PubMed
    1. Babu M.M., Luscombe N.M., Aravind L., Gerstein M., Teichmann S.A. Structure and evolution of transcriptional regulatory networks. Curr. Opin. Struct. Biol. 2004;14:283–291. - PubMed
    1. Vaquerizas J.M., Kummerfeld S.K., Teichmann S.A., Luscombe N.M. A census of human transcription factors: function, expression and evolution. Nat. Rev. Genet. 2009;10:252–263. - PubMed
    1. Zhang H.M., Chen H., Liu W., Liu H., Gong J., Wang H., Guo A.Y. AnimalTFDB: a comprehensive animal transcription factor database. Nucleic Acids Res. 2012;40:D144–D149. - PMC - PubMed
    1. Davidson E.H. The Regulatory Genome: Gene Regulatory Networks in Development and Evolution. San Diego: Academic Press; 2010.

Publication types

Substances