. 2014 Oct 10:5:5166.
doi: 10.1038/ncomms6166.

Inflammation-driven carcinogenesis is mediated through STING

Affiliations

Inflammation-driven carcinogenesis is mediated through STING

Jeonghyun Ahn et al. Nat Commun. .

Abstract

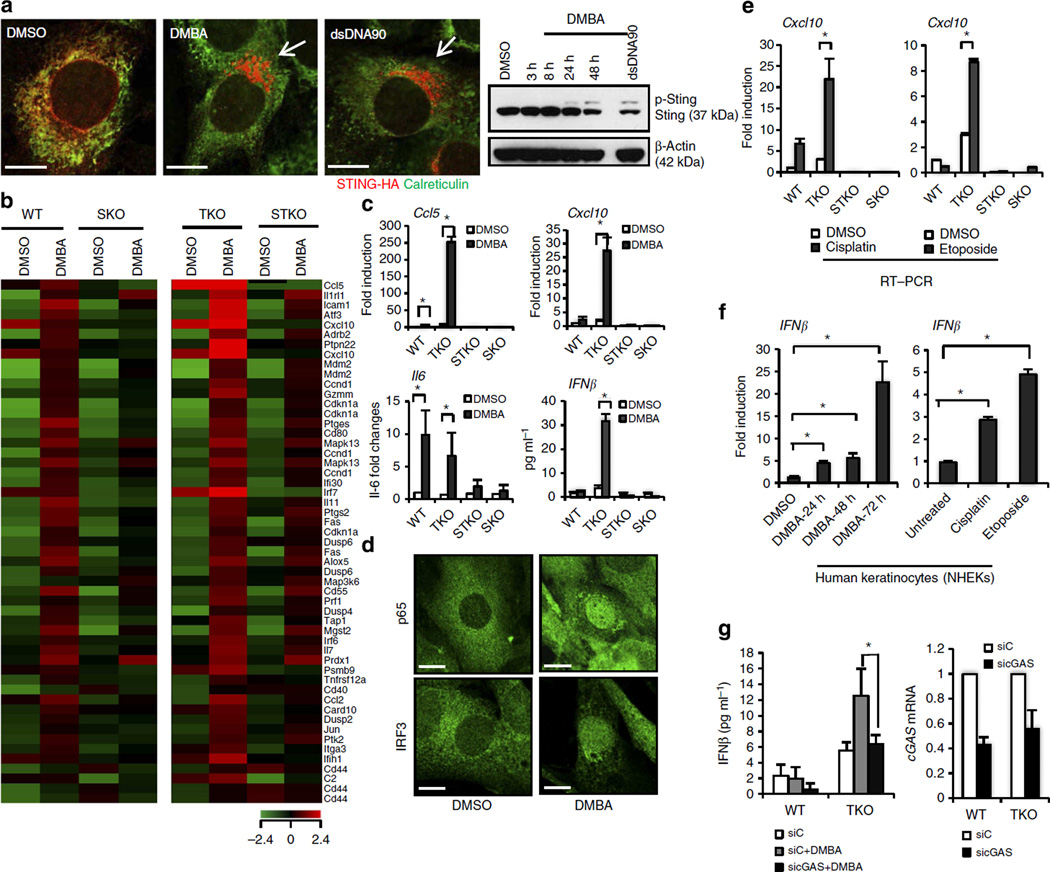
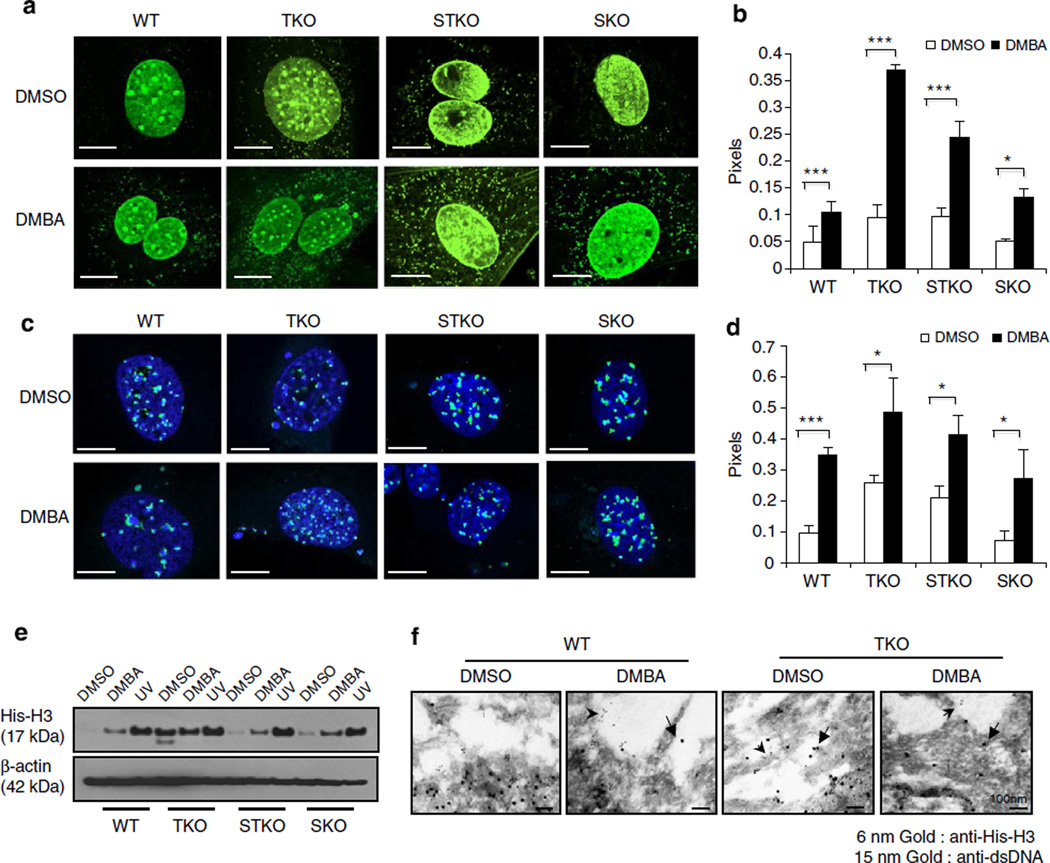
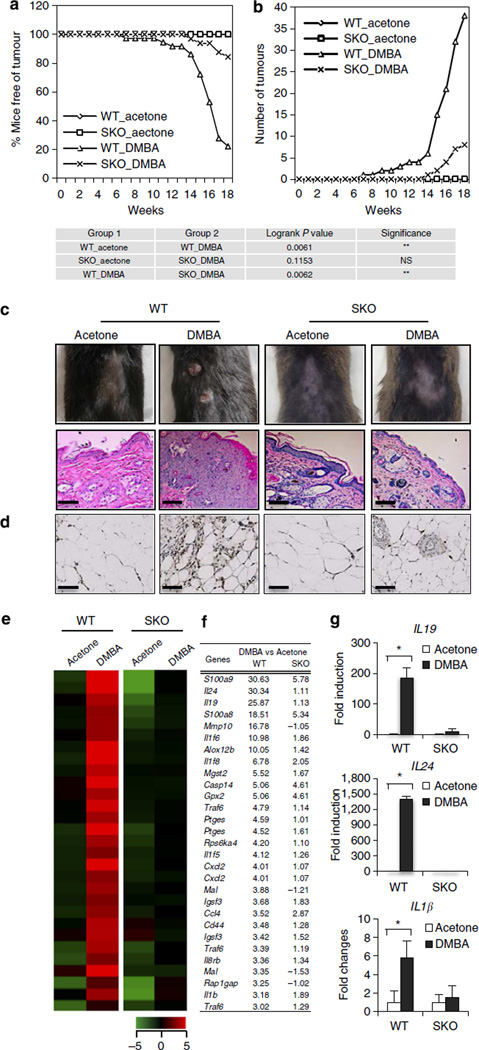
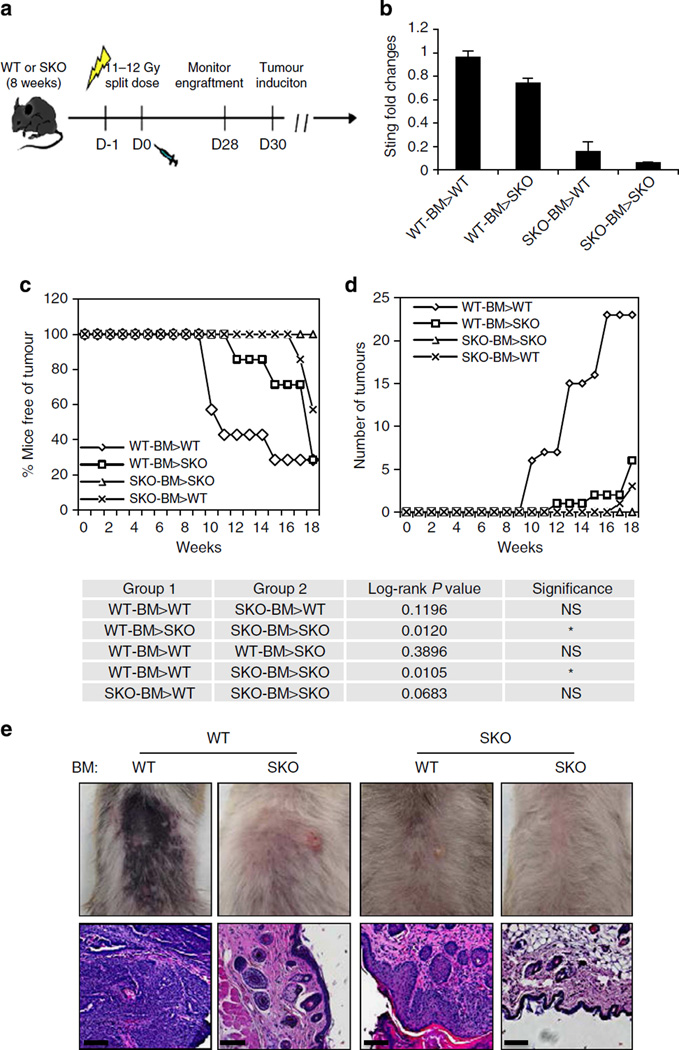
Chronic stimulation of innate immune pathways by microbial agents or damaged tissue is known to promote inflammation-driven tumorigenesis by mechanisms that are not well understood. Here we demonstrate that mutagenic 7,12-dimethylbenz(a)anthracene (DMBA), cisplatin and etoposide induce nuclear DNA leakage into the cytosol that intrinsically activates stimulator of interferon genes (STING)-dependent cytokine production. Inflammatory cytokine levels are subsequently augmented in a STING-dependent extrinsic manner by infiltrating phagocytes purging dying cells. Consequently, STING(-/-) mice, or wild-type mice adoptively transferred with STING(-/-) bone marrow, are almost completely resistant to DMBA-induced skin carcinogenesis compared with their wild-type counterparts. Our data establish a role for STING in the control of cancer, shed significant insight into the causes of inflammation-driven carcinogenesis and may provide a basis for therapeutic strategies to help prevent malignant disease.


Figures

Figure 1
Figure 1. The role of STING in DMBA-induced cytokine production
(a) WT MEFs expressing STING-HA were either transfected with 3 µg ml−1 of dsDNA90 for 3 h or treated with 20 µg ml−1 of DMBA. DMSO treatment was included as control. Using HA antibody for STING and anti-calreticulin for ER marker, immunofluorescence microscopy analysis was performed 48 h after DMBA treatment (left, original magnification at × 1,260; bar size, 10 µm) and immunoblot analysis was performed at the designated time points (right), (also see Supplementary Fig. 10). p-Sting, phosphorylated STING. (b) Gene array analysis of WT, TKO, STKO and SKO MEFs treated with DMBA at 20 µg ml−1 or DMSO as control for 48 h. Highest variable inflammation-related genes are shown. Rows represent individual genes; columns represent individual samples. Pseudo-colours indicate transcript levels below (green), equal to (black) or above (red) the mean. Scale represents the intensity of gene expression (log2 scale ranges between −2.4 and 2.4). (c) Quantitative PCR (qPCR) analysis and IFNβ ELISA assay of MEFs treated with DMBA same as in b. (d) Immunofluorescence microscopy analysis of p65 and IRF3 in WT MEFs treated with DMBA same as in b. Original magnification, × 1,260; bar size, 10 µm. (e) qPCR analysis of WT, TKO, STKO and SKO MEFs treated with 10 µM of cisplatin or 250 µM of etoposide for 48 h. DMSO treatment was included as controls. (f) qPCR analysis of IFNβ messenger RNA in human keratinocytes treated with 20 µg ml−1 of DMBA for 24, 48 or 72 h or with 10 µM of cisplatin or 250 µM of etoposide for 48 h. (g) WT and TKO MEFs were transfected with cGAS or control small interfering RNA (siRNA) for 48 h followed by DMBA treatment same as in b, and were then subjected to the IFNβ ELISA assay. cGAS expression level after siRNA treatment was determined by qPCR. Data are representative of at least two independent experiments. Error bars indicate s.d. *P < 0.05, Student’s t-test. WT; Sting+/+ Trex1+/+, SKO; Sting−/− Trex1+/+, TKO; Sting+/+, Trex1−/−, STKO; Sting−/−, Trex1−/−.
Figure 2
Figure 2. Cytoplasmic nucleosome production in DMBA-treated cells is independent of STING
(a) Fluorescence microscopy analysis of anti-dsDNA staining (a,b) and fluorescent in situ hybridization (FISH) with mouse centromere probe (c,d) in WT, TKO, STKO and SKO MEFs treated with DMBA at 20 µg ml−1 or DMSO as control for 48 h. Representative images are shown at × 1,260; bar size, 10 µm (a,c), and ratio of cytoplasm to nucleus anti-dsDNA pixels from a and FISH pixels from c was quantitated using Leica LAS AF software (b,d). (e) Immunoblot analysis of histone H3 in cytoplasmic extraction from MEFs treated with DMBA same as in a or ultraviolet at 120 mJ cm−2 followed by 24-h incubation (also see Supplementary Fig. 10). (f) Electron microscopy analysis of histone H3 and dsDNA gold staining in WT and TKO MEFs treated with DMBA same as in a. Arrows indicate gold particles in cytoplasm. Images were shown at original magnification, × 100,000; bar size, 100 nm. Data are representative of at least two independent experiments. Error bars indicate s.d. *P < 0.05, ***P < 0.001, Student’s t-test.
Figure 3
Figure 3. DMBA-induced skin carcinogenesis is mediated through STING
(a) Percentage of skin-tumour-free mice and (b) number of skin tumours from DMBA-treated WT (n = 18) and SKO mice (n = 16). Acetone is used as control treatment. Results are shown in the Kaplan–Meier curve for the representative of two independent experiments. P value of tumour incidence between group 1 and group 2 was calculated from the log-rank test. (c) Representative photographs of skin tumours and haematoxylin/eosin staining of the mice same as in a; all images were shown at original magnification, × 200; bar size, 200 µm. (d) CD68 immunohistochemistry staining of skin/tumours from mice same as in a; all images were shown at original magnification, × 400; bar size, 100 µm. (e) Gene array analysis of skin/tumour RNA isolated from the mice same as in a and (f) fold change values. Highest variable inflammation-related genes are shown. Rows represent individual genes; columns represent individual samples. Pseudo-colours indicate transcript levels below (green), equal to (black) or above (red) the mean. Scale represents the intensity of gene expression (log2 scale ranges between −5 and 5). (g) Quantitative PCR analysis of IL19, IL24 and IL1β from RNA same as in e. Data are the mean of three independent mice. Error bars indicate s.d. *P < 0.05, Student’s t-test. NS, not significant.
Figure 4
Figure 4. STING in hematopoietic cells contributes to DMBA-induced carcinogenesis
(a) Schematic representation of bone marrow transplantation (BMT). (b) STING expression level in peripheral blood mononucleated cell 4 weeks post BMT. Transplant groups are labelled as: donor bone marrow > recipient. (c) Percentage of skin-tumour-free mice and (d) number of skin tumours from DMBA-treated mice previously transplanted with bone marrow as indicated. N = 7 per group. Results are shown in the Kaplan–Meier curve. P value of tumour incidence between group 1 and group 2 was calculated from the log-rank test. (e) Representative photographs of skin tumours and haematoxylin/eosin staining of the mice same as in c. Images are shown at original magnification, × 200; bar size, 200 µm. NS, not significant.

References

    1. Grivennikov SI, Greten FR, Karin M. Immunity, inflammation, and cancer. Cell. 2010;140:883–899. - PMC - PubMed
    1. Trinchieri G. Cancer and inflammation: an old intuition with rapidly evolving new concepts. Annu. Rev. Immunol. 2012;30:677–706. - PubMed
    1. Nagata S, Hanayama R, Kawane K. Autoimmunity and the clearance of dead cells. Cell. 2010;140:619–630. - PubMed
    1. Kawasaki T, Kawai T, Akira S. Recognition of nucleic acids by pattern-recognition receptors and its relevance in autoimmunity. Immunol. Rev. 2011;243:61–73. - PMC - PubMed
    1. Ahn J, Gutman D, Saijo S, Barber GN. STING manifests self DNA-dependent inflammatory disease. Proc. Natl Acad. Sci. USA. 2012;109:19386–19391. - PMC - PubMed

MeSH terms

Associated data