. 2015 Jan;29(1):11-24.
doi: 10.1096/fj.14-251991. Epub 2014 Oct 9.

Regulation and biological function of a flagellar glucose transporter in Leishmania mexicana: a potential glucose sensor

Affiliations

Regulation and biological function of a flagellar glucose transporter in Leishmania mexicana: a potential glucose sensor

Dayana Rodriguez-Contreras et al. FASEB J. 2015 Jan.

Abstract

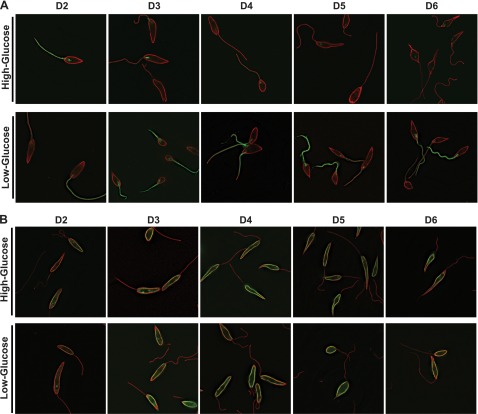
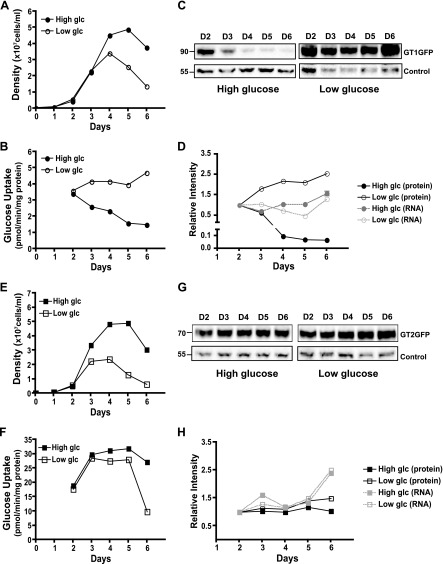
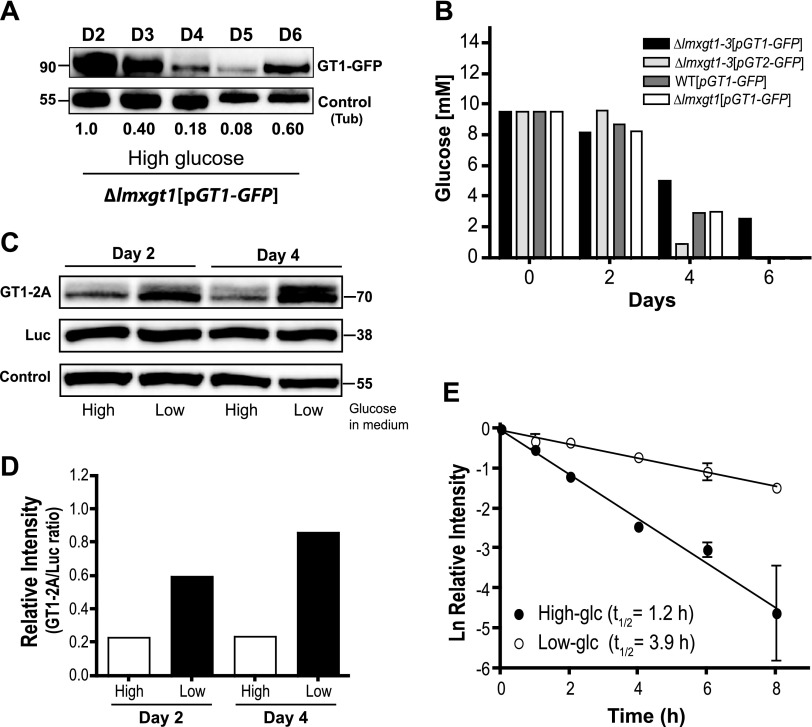
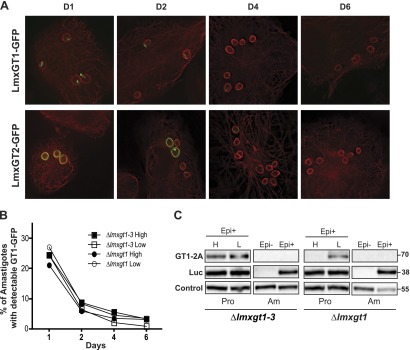
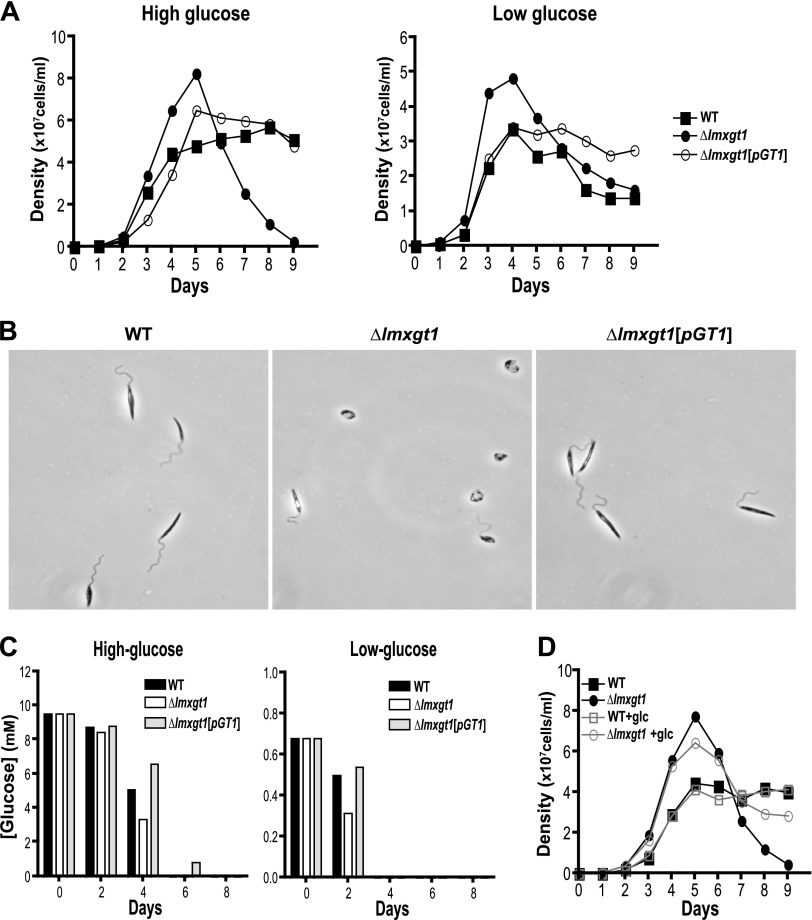
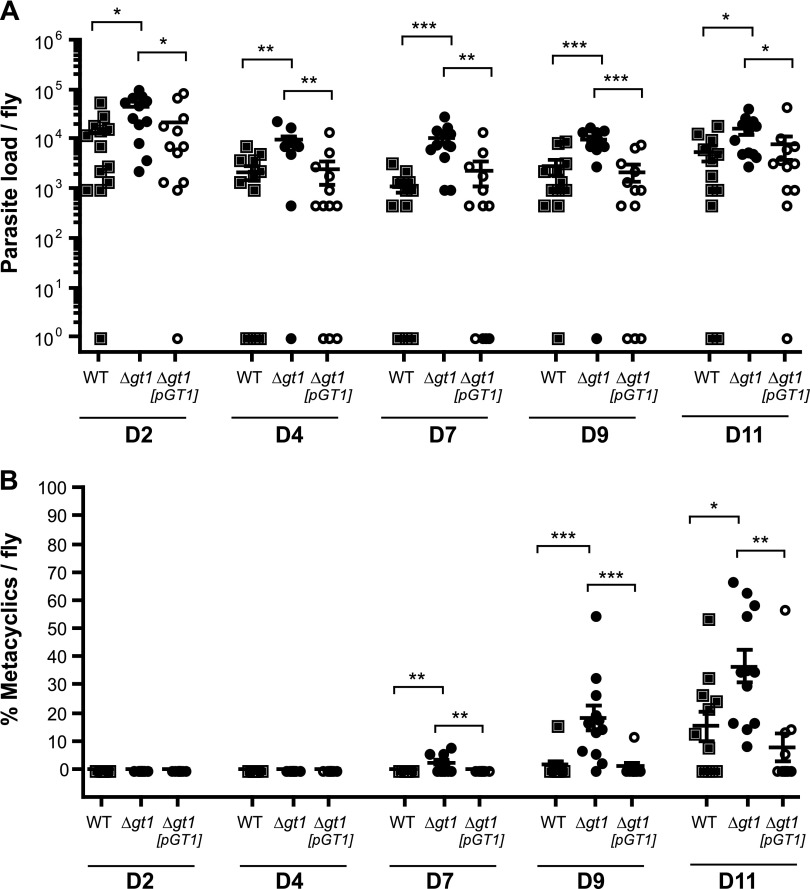
In Leishmania mexicana parasites, a unique glucose transporter, LmxGT1, is selectively targeted to the flagellar membrane, suggesting a possible sensory role that is often associated with ciliary membrane proteins. Expression of LmxGT1 is down-regulated ∼20-fold by increasing cell density but is up-regulated ∼50-fold by depleting glucose from the medium, and the permease is strongly down-regulated when flagellated insect-stage promastigotes invade mammalian macrophages and transform into intracellular amastigotes. Regulation of LmxGT1 expression by glucose and during the lifecycle operates at the level of protein stability. Significantly, a ∆lmxgt1 null mutant, grown in abundant glucose, undergoes catastrophic loss of viability when parasites deplete glucose from the medium, a property not exhibited by wild-type or add-back lines. These results suggest that LmxGT1 may function as a glucose sensor that allows parasites to enter the stationary phase when they deplete glucose and that in the absence of this sensor, parasites do not maintain viability when they run out of glucose. However, alternate roles for LmxGT1 in monitoring glucose availability are considered. The absence of known sensory receptors with defined ligands and biologic functions in Leishmania and related kinetoplastid parasites underscores the potential significance of these observations.

Keywords: Leishmania parasites; TaV2A peptide; environmental sensing; protein expression; transceptor.


Figures

Figure 1.
Figure 1.
Immunofluorescence images of ∆lmxgt1-3 null mutant parasites expressing LmxGT1-GFP (A) or LmxGT2-GFP (B) from an episomal expression vector. Parasites were inoculated at a density of 1 × 10⁵ cells/ml and grown for 6 d in RPMI 1640 medium containing high (10 mM) or low (0.5 mM) initial glucose. Samples were withdrawn at days 2, 3, 4, 5, and 6 (D2–D6) for fixation and imaging by deconvolution microscopy. Promastigotes were stained with anti-α-tubulin and Alexa Fluor 594-conjugated antibodies (red) to visualize the subpellicular microtubule network. Green represents GFP.
Figure 2.
Figure 2.
Expression of LmxGT1-GFP (A–D) and LmxGT2-GFP (E–H) as a function of days in culture and in the presence of high (10 mM) or low (0.5 mM) glucose. Each GFP-tagged transporter gene was expressed in a ∆lmxgt1-3 null mutant background. A and E) Cell density for each transgenic null mutant was quantified and plotted as the average of triplicate determinations. glc, glucose. B and F) The rate of uptake of 100 µM [3H]d-glucose by each transgenic line as a function of days of growth and high or low glucose. C and G) Western blot of total lysates probed with anti-GFP antibody. Control represents a cross-reacting band and was used for normalization. Numbers to the left of each blot in this and other figures represent molecular-weight markers (in kilodaltons). D and H) Quantification of the Western blot signal for each GFP fusion protein (protein) and for the corresponding mRNA (RNA). For protein, the intensity of the Western blot signal was normalized to that of the loading control for each sample. RNA was quantified by qRT-PCR of total RNA from each sample and normalized to 18 S rRNA. Samples from day 2 were set to a relative intensity value of 1.0, and other samples were normalized to those on day 2. Culture aliquots used in all panels for A–D and E–H were withdrawn from the same cultures to ensure sample uniformity across different assays.
Figure 3.
Figure 3.
Regulation of LmxGT1 expression by glucose. A) Expression of LmxGT1-GFP in ∆lmxgt1 null mutant background as a function of days in culture in the presence of high glucose. Parasites were inoculated at a density of 1 × 10⁵ cells/ml and grown for 6 d. Western blot represents total cell lysates probed with anti-GFP antibody. The control band represents α-tubulin (Tub). The numbers below each lane indicate the relative intensity of the GT1-GFP signal on each day. The GT1-GFP signal was first normalized to the intensity of the tubulin control in the same lane, and all numbers were then renormalized to the signal on day 2, which was set at a value of 1.0. B) Quantification of glucose in the medium for each indicated parasite line grown in high glucose medium. Parasites were removed from 1.5 ml culture by centrifugation, followed by filtration through a Millex-GP Filter Unit (0.22 µm; Millipore). The glucose content in the culture supernatants was determined by use of a glucose assay kit (Eton Bioscience, San Diego, CA, USA) (35). Values plotted represent the average of triplicate determinations. C and D) Quantification of the relative expression of GT1-2A and Luc polypeptides in parasites encoding the LmxGT1-TaV2A-Luc ORF on an episome and cultured in high and low glucose. Samples were collected at 2 and 4 d after inoculation and analyzed by Western blotting, probed with anti-TaV2A and anti-Luc antibodies. C) Western blot developed with anti-horseradish peroxidase antibody. Control represents the signal from a cross-reacting band. Positions of molecular-weight markers (∼38 and ∼70 kDa) are indicated. D) Quantification of relative intensity of GT1-2A and Luc signals as a function of high (High) or low (Low) glucose in the medium. The blot in C was digitized at several different exposures, and the ratio of the band intensities was calculated (GT1-2A:Luc ratio). Data represent the average of the ratios from the different scans. E) Quantification of half-life (t1/2) for LmxGT1-TaV2A protein in high (High-glc) and low (Low-glc) glucose. Parasites expressing this fusion protein and Luc from an episome were treated with cycloheximide, and samples were withdrawn for immunoblotting at the times indicated. The intensity of the LmxGT1-TaV2A signal for each sample was normalized to that of Luc, a stable protein with a half-life of days, and these normalized intensities were then renormalized to the value of 1.0, assigned to the t = 0 intensity to give relative intensity. Data represent the average and range of two replicate experiments. Ln, the logarithm to the base of each relative intensity value.
Figure 4.
Figure 4.
Expression of LmxGT1-GFP and LmxGT2-GFP following infection of macrophages. A) THP-1 macrophages were infected with ∆lmxgt1-3 null mutants expressing each GFP fusion protein, and deconvolution fluorescence images were recorded for cells at days 1, 2, 4, and 6 postinfection. Green represents GFP, and red represents fluorescence from an anti-α-tubulin antibody. B) The percentage of amastigotes with detectable GFP signal was plotted vs. days postinfection for ∆lmxgt1-3 and ∆lmxgt1 null mutants expressing LmxGT1-GFP from an episomal expression vector in high and low glucose. Typically, 80–-150 amastigotes were counted per sample. C) Loss of LmxGT1-TaV2A signal when parasites transform from promastigotes to amastigotes. Lines encoding the LmxGT1-TaV2A-Luc ORF on an episomal vector were prepared in the ∆lmxgt1-3 and ∆lmxgt1 null mutant backgrounds. Expression of GT1-2A and Luc from the cotranslationally cleaved translation product was monitored by Western blot by use of anti-TaV2A and anti-Luc antibodies. For amastigotes (Am), lysates were prepared from parasites without the episome (Epi–) as a negative control and from parasites encompassing the LmxGT1-TaV2A-Luc-encoding episome (Epi+). For promastigotes (Pro), lysates were prepared from early logarithmic-phase parasites (day 2 of growth) of the episome-carrying (Epi+) line, cultured in the presence of high glucose (H) or low glucose (L). In this experiment, the LmxGT1-TaV2A protein apparently began to down-regulate in the high glucose-cultured promastigotes in the ∆lmxgt1 line (fifth lane from the left) more rapidly than it did in the ∆lmxgt1-3 line (first lane from the left). The band marked Control refers to a cross-reacting signal used as a loading control.
Figure 5.
Figure 5.
Viability of WT, ∆lmxgt1 null mutants, and ∆lmxgt1[pGT1] add-back lines as a function of days of growth in high and low glucose. A) Growth curves for each cell line in high (left) and low (right) glucose. Values plotted represent the average of triplicate measurements. B) Phase-contrast microscopic images of parasites from each line at day 8 of growth in high glucose medium. C) Quantification of glucose in the medium for each parasite line grown in high or low glucose medium. Measurements were made as in Fig. 3B. D) Cell density of WT and ∆lmxgt1 (∆lmgt1) null mutants grown without or with (+glc) daily supplementation of the medium with 2.5 mM glucose. Data were plotted as the mean of the three replicate measurements.
Figure 6.
Figure 6.
Infection of L. longipalpis sandflies by WT (filled squares), ∆lmxgt1 (filled circles), and ∆lmxgt1[pGT1] (open circles) promastigotes. Sandflies were dissected from days 2, 4, 7, 9, and 11 postinfection, and the parasite load (A) and percent metacyclic forms (B) in the midgut were quantified. Error bars represent the geometric mean ± sem. In both graphs, WT, ∆gt1, and ∆gt1[pGT1] represent WT, ∆lmxgt1 null mutants, and ∆lmxgt1[pGT1] add-back promastigotes, respectively. Similar results were obtained from two independent experiments. Significant differences are shown as *P < 0.05; **P < 0.01; and ***P < 0.001.

Comment in

  • Transporters, channels and receptors in flagella.
    Rodriguez-Contreras D, Landfear SM. Rodriguez-Contreras D, et al. Channels (Austin). 2014;8(6):477-8. doi: 10.4161/19336950.2014.985481. Channels (Austin). 2014. PMID: 25485659 Free PMC article. No abstract available.

References

    1. Rodrigues J. C., Godinho J. L., and de Souza W. (2014) Biology of human pathogenic trypanosomatids: epidemiology, lifecycle and ultrastructure. Subcell. Biochem. 74, 1–42 - PubMed
    1. Gluenz E., Ginger M. L., and McKean P. G. (2010) Flagellum assembly and function during the Leishmania life cycle. Curr. Opin. Microbiol. 13, 473–479 - PubMed
    1. Gluenz E., Höög J. L., Smith A. E., Dawe H. R., Shaw M. K., and Gull K. (2010) Beyond 9+0: noncanonical axoneme structures characterize sensory cilia from protists to humans. FASEB J. 24, 3117–3121 - PMC - PubMed
    1. Landfear S. M. (2011) Nutrient transport and pathogenesis in selected parasitic protozoa. Eukaryot. Cell 10, 483–493 - PMC - PubMed
    1. Naderer T., and McConville M. J. (2008) The Leishmania-macrophage interaction: a metabolic perspective. Cell. Microbiol. 10, 301–308 - PubMed

Publication types

MeSH terms

LinkOut - more resources