. 2014 Dec;2(12):1186-98.
doi: 10.1158/2326-6066.CIR-14-0083. Epub 2014 Oct 9.

c-Abl modulates tumor cell sensitivity to antibody-dependent cellular cytotoxicity

Affiliations

c-Abl modulates tumor cell sensitivity to antibody-dependent cellular cytotoxicity

Joseph C Murray et al. Cancer Immunol Res. 2014 Dec.

Abstract

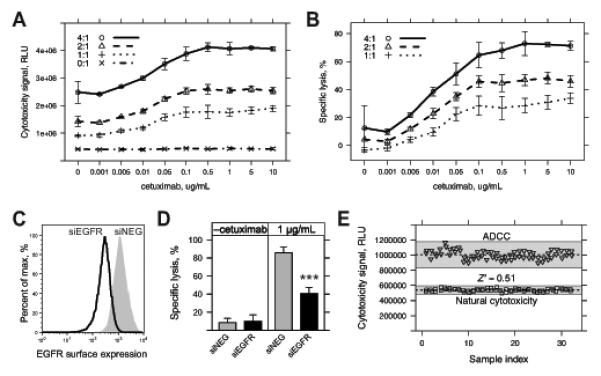
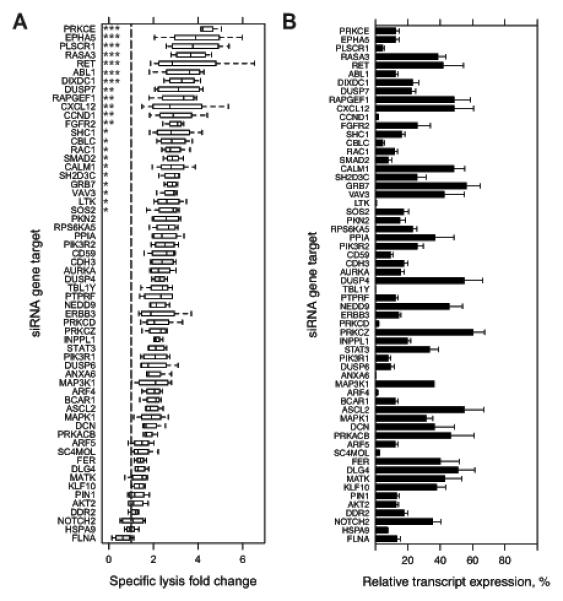
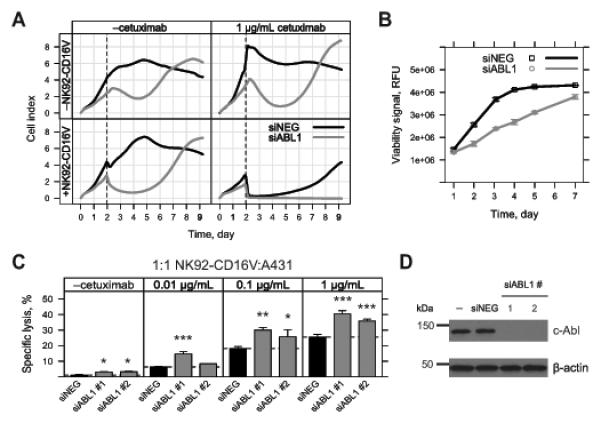
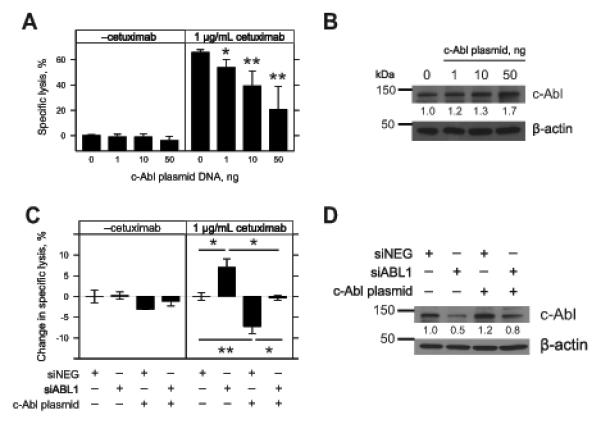
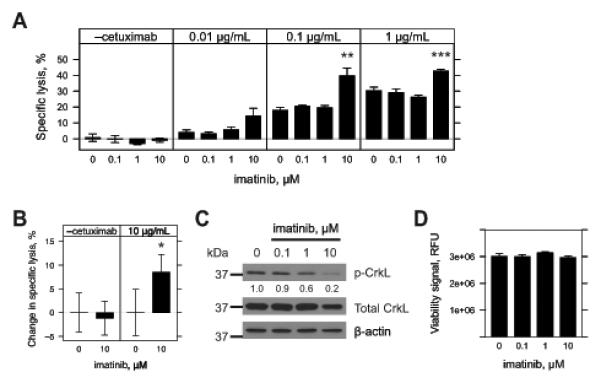
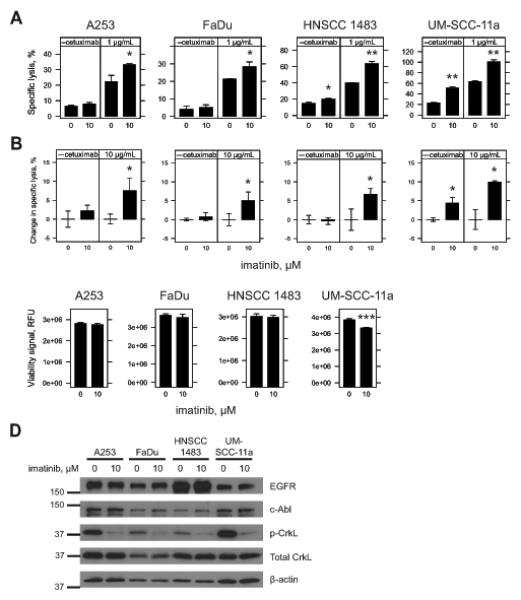
Monoclonal antibodies (mAb) can modulate cancer cell signal transduction and recruit antitumor immune effector mechanisms-including antibody-dependent cellular cytotoxicity (ADCC). Although several clinically effective antibodies can promote ADCC, therapeutic resistance is common. We hypothesized that oncogenic signaling networks within tumor cells affect their sensitivity to ADCC. We developed a screening platform and targeted 60 genes derived from an EGFR gene network using RNAi in an in vitro ADCC model system. Knockdown of GRB7, PRKCE, and ABL1 enhanced ADCC by primary and secondary screens. ABL1 knockdown also reduced cell proliferation, independent of its ADCC enhancement effects. c-Abl overexpression decreased ADCC sensitivity and rescued the effects of ABL1 knockdown. Imatinib inhibition of c-Abl kinase activity also enhanced ADCC-phenocopying ABL1 knockdown-against several EGFR-expressing head-and-neck squamous cell carcinoma cell lines by ex vivo primary natural killer cells. Our findings suggest that combining c-Abl inhibition with ADCC-promoting antibodies, such as cetuximab, could translate into increased therapeutic efficacy of mAbs.


Figures

Figure 1
Figure 1
Development and characterization of a functional genomics screening assay for assessment of ADCC. A, A431 cells were seeded overnight in 96-well plates and then treated with vehicle (media), cetuximab only, NK92-CD16V only, and combined cetuximab and NK92-CD16V treatments. Cytotoxicity signal (relative luminescence units, RLU) was assessed 4 h later across a range of concentrations of cetuximab (0-10 μg/mL) and effector-to-target ratios (E:T, 0:1-4:1). B, Specific lysis was calculated from the cytotoxicity signal values in A by subtraction of initial A431 cytotoxicity and NK92-CD16V spontaneous cytotoxicity from combined treatment-induced cytotoxicity, before normalization by total A431 cytotoxicity (see Materials & Methods for details). C, A431 cells were reverse transfected with 10 nM EGFR siRNA (siEGFR) or negative control siRNA (siNEG) and collected 48 h later. Cells were stained with cetuximab and anti-human IgG(H+L)-PE-conjugated secondary antibody to assess EGFR surface expression or with secondary antibody alone. Secondary Ab only staining was similar to unstained controls (not shown) for all transfected cell lines. D, A431 cells were reverse transfected as in C and assessed for ADCC 48 h later. Specific lysis was assessed using a 4:1 E:T using NK92-CD16V effector cells in the absence (–cetuximab) or presence of 1 μg/mL cetuximab. Specific lysis of A431 cells by NK92-CD16V cells following knockdown of EGFR (siEGFR, black bars) was compared to negative control siRNA (siNEG, gray bars) in the absence and presence of cetuximab. ***, p<0.001 from two-tailed t-test. E, A431 cells seeded overnight in 96-well plates were treated with 1:1 E:T of NK92-CD16V cells in the absence (“natural cytotoxicity”, squares) or presence (“ADCC”, triangles) of 1 μg/mL cetuximab. Cytotoxicity was assessed 4 h later. Z’-factor, which measures the suitability of an assay for screening, was assessed between the ADCC vs. natural cytotoxicity treatments. Dashed lines represent the mean of sample replicates and shaded area represents ±3 standard deviations (s.d.) from the mean. The Z’-factor incorporates both sample mean and ±3 s.d. For all panels, error bars represent s.d. of at least three independent experiments (n=3).
Figure 2
Figure 2
Primary siRNA screen targeting A431 cells for genes whose knockdown enhances ADCC. A, Two primary screens were conducted in which an arrayed library of two pooled siRNA at 10 nM each per 60 targeted genes were reverse transfected in A431 cells in 96-well plates. At 48 h post-transfection, three treatments were added: 1 μg/mL cetuximab alone; 20,000 NK92-CD16V cells alone; and the combination of cetuximab and NK92-CD16V cells. All transfections and treatments were conducted in duplicate for each primary screen. Specific lysis of the combined cetuximab and NK92-CD16V cell treatments was calculated for each replicate siRNA gene target. Specific lysis fold-change relative to a negative control siRNA (dashed vertical line, normalized to 1) was calculated for each replicate in each screen. Specific lysis fold-change values are represented as boxplots of two independent measurements in two primary screens (n=4). Statistical significance was assessed by ANOVA followed by Dunnett’s multiple comparison test correction for each siRNA gene target versus the negative control siRNA. *, p<0.05; **, p<0.01; and ***, p<0.001. B, A431 cells were reverse transfected as described in A, RNA isolated 48 h later, cDNA generated, and real-time quantitative reverse-transcription PCR (q-RT-PCR) was conducted to assess knockdown of each targeted genes. Percent relative expression was calculated compared to the negative control siRNA transfection and calibrated by GAPDH expression. Percent relative expression for each siRNA target genes are ordered as in A. *, p<0.05; and **, p<0.01. Error bars represent s.d. of the mean from three independent experiments (n=3).
Figure 3
Figure 3
Characterizing the effect of ABL1 knockdown on proliferation, viability, and sensitivity to ADCC in A431 cells. A, A431 cells were reverse transfected with 10 nM ABL1 (siABL1, gray) or negative control siRNA (siNEG, black) in a 96-well real-time cell assay (RTCA) plate. Cell index was measured by RTCA every 10 min over the entire time course of the experiment (9 days). Cell index was derived from the impedance of adhered cells in the individual wells of the RTCA plate. Following reverse transfection, treatments were added at 48 h (dashed line) as follows: top left, vehicle (media); top right, 1 μg/mL cetuximab; bottom left, 20,000 NK92-CD16V effector cells; bottom right, 1 μg/mL cetuximab and 20,000 NK92-CD16V effector cells. Each cell index line represents the mean of three independent assessments (n=3) from one representative of three experiments. B, A431 cells were reverse transfected 10 nM ABL1 siRNA (siABL1, gray) or negative control siRNA (siNEG, black) in 96-well format. Fluorometric viability assays were conducted at the indicated time points. Each viability measurement represents the mean of three independent measurements (n=3) from one representative of four experiments. C, A431 cells were reverse transfected in six-well plates with 10 nM ABL1 siRNA (siABL1 #1 or #2, gray bars) or negative control siRNA (siNEG, black bars). siABL1 #1 is the same ABL1 siRNA used in A. Reverse transfected cells were collected at 48 h and re-plated at 20,000 viable cells/well in a 96-well plate. Following a brief incubation, the following treatments were added: vehicle (media); cetuximab (0.01, 0.1 and 1 μg/mL); 20,000 NK92-CD16V cells; and 20,000 NK92-CD16V cells and cetuximab (0.01, 0.1 and 1 μg/mL). Cytotoxicity was assessed 4 h later and specific lysis by NK92-CD16V cells was determined in the absence or presence of cetuximab. Each ABL1 siRNA was compared to the negative control siRNA within each sub-panel. *, p<0.05; **, p<0.01; and ***, p<0.001 from two-tailed t-tests. Results are from three independent experiments (n=3). D, A431 cells were reverse transfected without siRNA (–) or with 10 nM negative control (siNEG) or ABL1 siRNA (siABL1 #1 or #2 as used in C). Cell lysates were collected, applied to SDS-PAGE, and transferred to a membrane, and blotted for c-Abl. c-Abl expression was undetectable for the two ABL1 siRNAs transfections, although faint bands were visible upon overexposure (data not shown). The same membrane was blotted for β-actin as a loading control. Results are representative of two experiments. For panels B and C, error bars represent s.d. of the mean.
Figure 4
Figure 4
Modulating c-Abl expression and sensitivity to ADCC in A431 cells. A, A431 cells were seeded overnight in 96-well plates and forward transfected with increasing quantities (1, 10, and 50 ng) of wild type c-Abl plasmid and compared to a mock transfection (0). After 24 h, the following treatments were added: vehicle (media); 1 μg/mL cetuximab; 20,000 NK92-CD16V cells; and 20,000 NK92-CD16V cells and 1 μg/mL cetuximab. Cytotoxicity was assessed 4 h later and specific lysis by NK92-CD16V cells was determined in the absence or presence of cetuximab. Each quantity of transfected plasmid was compared to the mock transfection control. Results are from three independent experiments (n=3). B, Cell lysates were collected from A431 cells following forward transfection of the wild type c-Abl plasmid as described in A. Western blot of c-Abl and β-actin was performed. Densitometry was conducted and c-Abl levels were normalized to β-actin levels and compared relative to the mock transfection control. Results are from one representative of three experiments. C, A431 cells were seeded overnight in 96-well plates and forward transfected with combinations of 10 nM negative control siRNA (siNEG), 10 nM ABL1 siRNA (siABL1), and 1 ng wild type c-Abl plasmid c-Abl. After 24 h, specific lysis was assessed (as described in A). Change in specific lysis was calculated by subtracting the negative control siRNA specific lysis within each sub-panel. Change in specific lysis was compared to the negative control siRNA within each sub-panel. Results are from three independent experiments (n=3). D, Cell lysates were collected following forward transfection of the negative control siRNA (siNEG), ABL1 siRNA (siABL1), and 1 ng wild type c-Abl plasmid as described in C. Western blot of c-Abl and β-actin was performed. Densitometry was conducted and c-Abl levels were normalized to β-actin and compared to negative control siRNA. Results are depicted for one representative of two experiments. For panels A and C, error bars represent s.d. of the mean. *, p<0.05 and **, p<0.01 by two-tailed t-test.
Figure 5
Figure 5
Inhibition of c-Abl kinase activity by imatinib in A431 cells and sensitivity to ADCC. A & B, A431 cells were seeded overnight in 96-well plates and treated with vehicle (0, DMSO) or imatinib (0.1, 1 or 10 μM) for 48 h. Treatments were aspirated and replaced with fresh growth media. Effector cells were added in the absence or presence of cetuximab (0.01, 0.1, and 1 μg/mL). Cytotoxicity was assessed 4 h later and specific lysis by effector cells was determined. For A, 20,000 NK92-CD16V effector cells were used. Results represent three independent experiments (n=3). For B, 50,000 IL-2 negatively-selected, IL2 stimulated NK effector cells were used. Percent-change in specific lysis was quantified to account for varying levels of donor specific lysis against target cells. Results represent one of two independent experiments using three independent donors (n=3). For A & B, imatinib pre-treatment was compared to vehicle within each sub-panel. *, p<0.05; **, p<0.01; and ***, p<0.001 by two-tailed t-test. C, A431 cells were seeded in six-well plates overnight and treated with vehicle (0, DMSO) or imatinib (0.1, 1 or 10 μM) and cell lysates collected 48 h later. Western blots were conducted and membranes blotted for phospho-CrkL (p-CrkL), stripped and re-blotted for both total CrkL and then β-actin. Densitometry was conducted and p-CrkL levels were normalized to total CrkL levels and then compared to vehicle treatment. Results are for one representative of two experiments. D, A431 cells were seeded overnight in 96-well plates and treated with vehicle (0, DMSO) or imatinib (0.1, 1 or 10 μM) for 48 h. Viability was assessed by fluorometric assay. No statistically significant differences were found between treatments by t-test. Results are from six independent experiments (n=6). For panels A, B & C, error bars represent s.d. of the mean.
Figure 6
Figure 6
Inhibition of c-Abl kinase activity by imatinib and sensitivity of HNSCC cell lines to ADCC. A & B, A253, FaDu, HNSCC 1483 and UM-SCC-11a cells were seeded overnight in 96-well plates and treated for 48 h with vehicle (0, DMSO) or imatinib (10 μM). Treatments were aspirated and replaced with fresh growth media just prior to addition of effector cells in the absence or presence of cetuximab. Cytotoxicity was assessed 4 h later and specific lysis was determined. For A, 40,000 NK92-CD16V cells were used in the absence or presence of 1 μg/mL cetuximab. For B, 50,000 IL2 negatively-selected, IL2 stimulated NK effector cells were used in the absence or presence of 10 μg/mL cetuximab. Percent change in specific lysis was quantified to account for varying levels of donor specific lysis against target cells. Results represent one of two independent experiments using three independent donors (n=3). C, A253, FaDu, HNSCC 1483 and UM-SCC-11a cells were seeded overnight in 96-well plates and treated for 48 h with vehicle (0, DMSO) or imatinib (10 μM). Viability was assessed by fluorometric assay. For A, B and C, imatinib pre-treatment was compared to vehicle control within each sub-panel. *, p<0.05; **, p<0.01; and ***, p<0.001 by two-tailed t-test. Results are from three independent experiments (n=3) for each cell line. Error bars represent s.d. of the mean. D, A253, FaDu, HNSCC 1483 and UM-SCC-11a cells were seeded in six-well plates overnight and treated for 48 h with vehicle (0, DMSO) or imatinib (10 μM). Cell lysates were collected and Western blots were conducted. c-Abl was blotted before stripping and re-blotting for EGFR. Phospho-CrkL (p-CrkL) was blotted for before re-blotting for both total CrkL and then β-actin as a loading control. Densitometry was conducted and relative expression was assessed within each cell line for vehicle and imatinib treatments (Supplementary Fig. 6C). Results are representative of two independent experiments.

References

    1. Weiner LM, Surana R, Wang S. Monoclonal antibodies: versatile platforms for cancer immunotherapy. Nat Rev Immunol. 2010;10:317–27. - PMC - PubMed
    1. Weiner LM, Murray JC, Shuptrine CW. Antibody-based immunotherapy of cancer. Cell. 2012;148:1081–4. - PMC - PubMed
    1. Wallace PK, Howell AL, Fanger MW. Role of Fc gamma receptors in cancer and infectious disease. J Leukoc Biol. 1994;55:816–26. - PubMed
    1. Chen Z, Freedman MS. CD16+ gammadelta T cells mediate antibody dependent cellular cytotoxicity: potential mechanism in the pathogenesis of multiple sclerosis. Clin Immunol. 2008;128:219–27. - PubMed
    1. Lanier LL. Up on the tightrope: natural killer cell activation and inhibition. Nat Immunol. 2008;9:495–502. - PMC - PubMed

Publication types

MeSH terms