. 2015 May;22(5):703-18.
doi: 10.1038/cdd.2014.158. Epub 2014 Oct 10.

Neuroprotection requires the functions of the RNA-binding protein HuR

Affiliations

Neuroprotection requires the functions of the RNA-binding protein HuR

A Skliris et al. Cell Death Differ. 2015 May.

Abstract

Alterations in the functions of neuronal RNA-binding proteins (RBPs) can contribute to neurodegenerative diseases. However, neurons also express a set of widely distributed RBPs that may have developed specialized functions. Here, we show that the ubiquitous member of the otherwise neuronal Elavl/Hu family of RNA-binding proteins, Elavl1/HuR, has a neuroprotective role. Mice engineered to lack exclusively HuR in the hippocampal neurons of the central nervous system (CNS), maintain physiologic levels of neuronal Elavls and develop a partially diminished seizure response following strong glutamatergic excitation; however, they display an exacerbated neurodegenerative response subsequent to the initial excitotoxic event. This response was phenocopied in hippocampal cells devoid of ionotropic glutamate receptors in which the loss of HuR results in enhanced mitochondrial dysfunction, oxidative damage and programmed necrosis solely after glutamate challenge. The molecular dissection of HuR and nElavl mRNA targets revealed the existence of a HuR-restricted posttranscriptional regulon that failed in HuR-deficient neurons and is involved in cellular energetics and oxidation defense. Thus, HuR acts as a specialized controller of oxidative metabolism in neurons to confer protection from neurodegeneration.


Figures

Figure 1
Figure 1
The loss of HuR from hippocampal neurons does not affect neuronal Elavl expression. (ad) Immunohistochemical detection of Elavl1/HuR and Elavl4/HuD in the hippocampi of control and CN-KO mice. (e) Detection of β-galactosidase activity in brains from CamKIICre+ROSA26fl mice. (f) Detection of Elavl1fl locus recombination via Southern blot analysis of genomic DNA isolated from different brain regions of Elavlfl/fl mice in the presence or absence CamKIICre. (g) Immunodetection of Elavls in lysates from control and CN-KO brain compartments using antisera for all Elavls (3A2 antibody), Elavl4/HuD and Elavl1/HuR. Lysates from the lung serve as a site for unique HuR expression. β-Actin serves as a loading control. Numerical marking on the left indicates protein marker positions. Note that both the 3A2 and anti-HuD antibodies react with bands higher than their predicted molecular weights (marking in right). In the 3A2 blots, bands higher than HuR may also include Elavl2 and 3, and hence are annotated as nElavls. Magnification bars: a, b and e, 100 μm; c and d, 20 μm. Cb, cerebellum; CrB, cerebrum; FL, frontal lobe; H, hematoxylin; Hc, hippocampus; Lu, lung; OlB, olfactory bulb; NFR: Nuclear Fast Red; ST, striatum
Figure 2
Figure 2
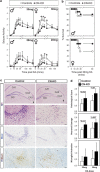
Differential involvement of HuR in kainate-induced excitation versus neurodegeneration. (a) Measurement of the extent of epileptic seizures after administration of two doses of KA. Data were derived from: male (♂) CN-KO and control mice at 30 mg/kg (n=17 and 20) and 20 mg/ml (n=9 and 7); and female (♀) CN-KO and control mice at 30 mg/kg (n=21 and 19) and 20 mg/ml (n=8 and 8). (b) Kaplan–Meier distribution of control and CN-KO male and female mice that survived from early epileptic seizures induced by KA administration. (c) Photomicrographs of hippocampi in paraffin brain sections from control and CN-KO mice killed 5 days following the administration of KA and chemically stained with hematoxylin/eosin, Nissl or immunostained for Mac3 and counterstained with hematoxylin. Magnification: upper panels, 100 μm; lower panels, 20 μm. (d) Histopathologic quantitation of the damaged area (hematoxylin/eosin) and loss of neurons (Nissl) from n=13 mixed-sex CN-KO mice and 16 control mice, and microglia activation (Mac3; CN-KO: n=7; control: n=17). *Statistical differences to control groups with a P≤0.05
Figure 3
Figure 3
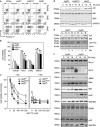
The loss of HuR enhances the sensitivity of hippocampal neurons to glutamate (Glu)-induced oxidative damage. (a) Timed death response of primary hippocampal cultures from control and CN-KO embryos in response to 20 μM KA or 100 μM glutamate (Glu) (first panel), and in the absence or presence of antagonists for ionotropic Glu receptors (AP5 and CNQX) or the antioxidant NAc (second panel, control; third panel, CN-KO). Data were derived from viability assays using PrestoBlue repeated for two times with three individual cultures per experiment. *Statistical differences to 0 h. (b) Death response of HT-22 knockdown cells to increasing doses of Glu for 20 h. Data were derived from MTT assays repeated for at 4–8 times with triplicate cultures per experiment. *Statistical differences to parental and control groups. (c) Detection of ROS in cells labeled with DCFDA and treated with the indicated quantities of Glu for 10 h. Data were derived (mean fluorometric values±S.D.) from two independent experiments with four replicas per experiment. *Statistical differences to parental and control groups with a P≤0.05. (d) Detection of mitochondrial membrane potentials or intracellular superoxide release via the flow cytometric analyses of changes in the intensities (FI) of DiOC6 or MitoSox Red, respectively; cells were monitored 10 h after exposure to 3 and 6 mM Glu. Numbers indicate the percentage of cells with reduced potential (lower intensity peak in DiOC6) or increased superoxide (high intensity peak in MitoSox) in each case. Representative data were derived from two independent experiments with triplicate per group per experiment. (e) Immunohistochemical detection of mitochondrial ATPase (catalytic alpha-subunit) as a marker of intact mitochondria in the CA2/3 region of control and CN-KO hippocampi challenged with KA. Counterstain: hematoxylin. Boxes in low magnifications (left; bar, 100 μm) indicate areas magnified in right (bar, 20 μm). Note the perinuclear granular staining in control neurons and its loss in intact and condensing hippocampal neurons from CN-KO mice (arrows). (f) Effect of the antioxidants NAc (1 mM), Trolox (0.1 mM) and PD146176 (0.5 μM) to the Glu-induced death response of HT-22 sublines and at 20 h after exposure. Data in bar graphs (mean values±S.D.) were derived from MTT assays repeated for at least four times with triplicate cultures per experiment. *Statistical differences to Glu (+solvent vehicle)-treated groups with a P≤0.05
Figure 4
Figure 4
The loss of HuR enhances BiD-mediated necrosis in glutamate-challenged neurons. (a) Flow cytometric detection of apoptotic and necrotic HT-22 cells containing or lacking HuR and in response to glutamate for 14 h and detection of AnxV and PI. Representative data were derived from two independent experiments with four replicas per group. (b) Effect of inhibitors of Nec-1 (25 μM), apoptosis (zVAD-fmk; 50 μM), BiD function (BI6C9; 10 μM) or DMSO vehicle on the death response of HT-22 sublines challenged with 6 mM glutamate for 20 h. Data in bar graphs (mean values±S.D.) were derived from MTT assays repeated for at least three times with triplicate cultures per experiment. *Statistical differences to glutamate (+solvent vehicle)-treated groups with a P≤0.05. (c) Effect of the Bcl-2/Bcl-xl inhibitor ABT-737 on the death response of HT-22 sublines challenged with 6 mM glutamate for 20 h. Data in histograms (mean values±S.D.) were derived from MTT assays repeated for two times with triplicate cultures per experiment. *Statistical differences to HuRhi controls. (d and e) Immunodetection of AIF and BiD in total cell, nuclear (N) and cytoplasmic (C) lysates from HT-22 cells containing or lacking HuR and exposed to 4 mM glutamate for the indicated time points. GAPDH, nuclear lamin A/C and actin are shown as loading and fractionation controls. Note the absence of detectable cleaved BiD (tBiD). (f) Representative immunodetection of Bcl-xl, Bcl-2, Bad, Bax, PARP and p53 in total cell lysates from HT-22 cells containing or lacking HuR and exposed to 4mM glutamate for the indicated time points. GAPDH is shown as the loading control. In all immunoblots, numerical marking on the left represent predicted molecular weights for each molecule
Figure 5
Figure 5
Examination of Elavl responses in glutamate-challenged neurons. (a) Bar graphs depicting differences in Elavl1, Elavl2 and Elavl4 mRNAs in HuRhi (white bars) and HuRlo (black bars) HT22 cells after treatment with 4 mM glutamate for 10 and 20 h. Data are presented as fold change±S.D. relative to HuRhi untreated cells and derive from qRT-PCR experiments using RNA from three individual cultures. *Increases and **decreases with P<0.01. (b) Representative immunodetection of all Elavls (3A2), Elavl4/HuD and Elavl1/HuR in total cell lysates from HT-22 cells containing or lacking HuR and exposed to 4 mM glutamate for the indicated time points. GAPDH is shown as the loading control. Numerical annotations on the right represent protein marker positions; named marking on the left indicate positions for the predicted molecular weights. (c) Quantitation of immunoblots is represented in (b); data were derived from three independent experiments. (d) Representative immunodetection of Elavls (3A2 antibody) in fractionated nuclear (N) and cytoplasmic (C) lysates from HT-22 cells containing or lacking HuR and exposed to 4 mM glutamate for the indicated time points. Nuclear lamin A/C and actin are shown as loading and fractionation controls. Marking on the right indicate positions at the predicted molecular weight for each molecule. Based on (b) and Supplementary Figure 9, we predict that nElavl corresponds to HuD. (e) Quantitation of immunoblots is represented in (d); data were derived from three independent experiments. (f) Immunodetection of HuR in immunoblots from 2D gels analyzing total lysates from parental HT-22 cells as untreated or treated with 4mM glutamate for 10 h. Direction (charges) and detected pI values are indicated
Figure 6
Figure 6
Exclusive HuR targeting of mRNAs used during antioxidant defenses. (a) qRT-PCR validation of selected mRNA targets in HuR/RNP IPs (black bars) or HuD/RNP IPs (gray bars) from HuRhi HT-22 neurons and in the absence (−) or presence (+) of 4 mM glutamate for 10 h. Data were derived form three biologic replicas and are presented as fold enrichment (±S.D.) of each mRNA in the IP samples compared with its abundance in IgG IPs. (b) Bar graphs depicting differences in selected mRNAs in HuRhi (white bars) and HuRlo (black bars) HT22 cells after treatment with 4 mM glutamate for 10 and 20 h. (c) Bar graphs depicting differences in selected mRNAs in control (white bars) and CN-KO (black bars) primary hippocampal neurons at DIV7 and after treatment with 100 μM glutamate for 4 h. For both (b) and (c), data are presented as fold change±S.D. relative to untreated control cells and are derived from qRT-PCR experiments using RNA from three individual cultures. *Increases and **decreases with P<0.05
Figure 7
Figure 7
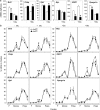
Effects of HuR's loss on mRNA turnover and translation. (a) Estimation of mRNA decay in actinomycin D-treated HuRhi (white bars) and HuRlo (black bars) HT22 neurons before and after glutamate (4 mM) challenge. Data are half-lives±S.D. estimated from qRT-PCR measurements and decay plots from three independent experiments (see also Supplementary Figure 11). (b) Detection of changes in mRNA translation by means of qRT-PCR in free, monosomal and polysomal fractions from HuRhi (white bars) and HuRlo (black bars) before and after glutamate treatment. Data from measurements±S.D. in individual fractions normalized to GAPDH mRNA and presented as total free, monosomal or polysomal percentages of cytoplasmic RNA (see also Supplementary Figure 12). *Statistically different to control values; **statistically different to unstimulated fractions. In all cases P≤0.01

Similar articles

Cited by

References

    1. Wang Y, Qin ZH. Molecular and cellular mechanisms of excitotoxic neuronal death. Apoptosis. 2010;15:1382–1402. - PubMed
    1. Danbolt N. Glutamate uptake. Progr Neurobiol. 2001;65:1–105. - PubMed
    1. Michaelis E. Molecular biology of glutamate receptors in the central nervous system and their role in excitotoxicity, oxidative stress and aging. Progr Neurobiol. 1998;54:369–415. - PubMed
    1. Darnell R. RNA protein interaction in neurons. Annu Rev Neurosci. 2013;36:243–270. - PMC - PubMed
    1. McKee A, Minet E, Stern C, Riahi S, Stiles CD, Silver PA, et al. A genome-wide in situ hybridization map of RNA-binding proteins reveals anatomically restricted expression in the developing mouse brain. BMC Dev Biol. 2005;5:1–9. - PMC - PubMed

Publication types

MeSH terms