

Is low fertility really a problem? Population aging, dependency, and consumption
- PMID: 25301626
- PMCID: PMC4545628
- DOI: 10.1126/science.1250542
Is low fertility really a problem? Population aging, dependency, and consumption
Abstract
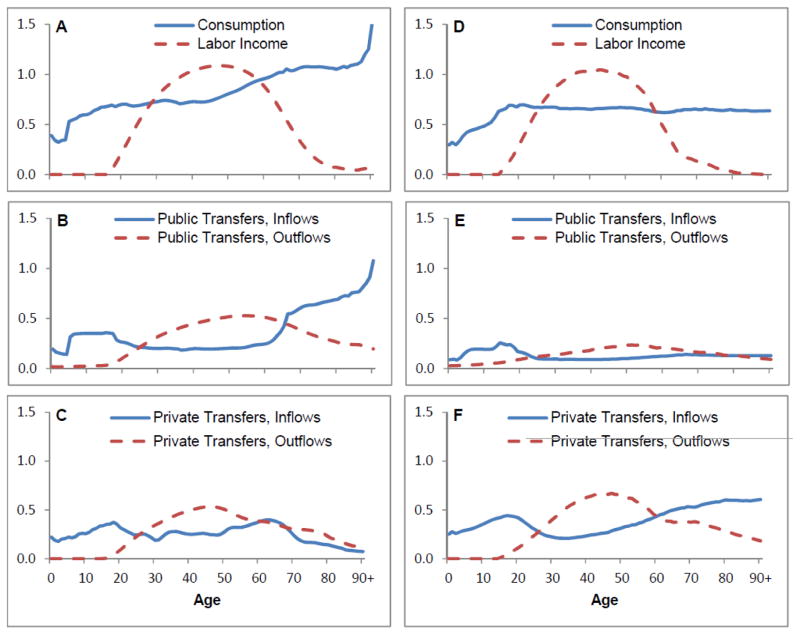
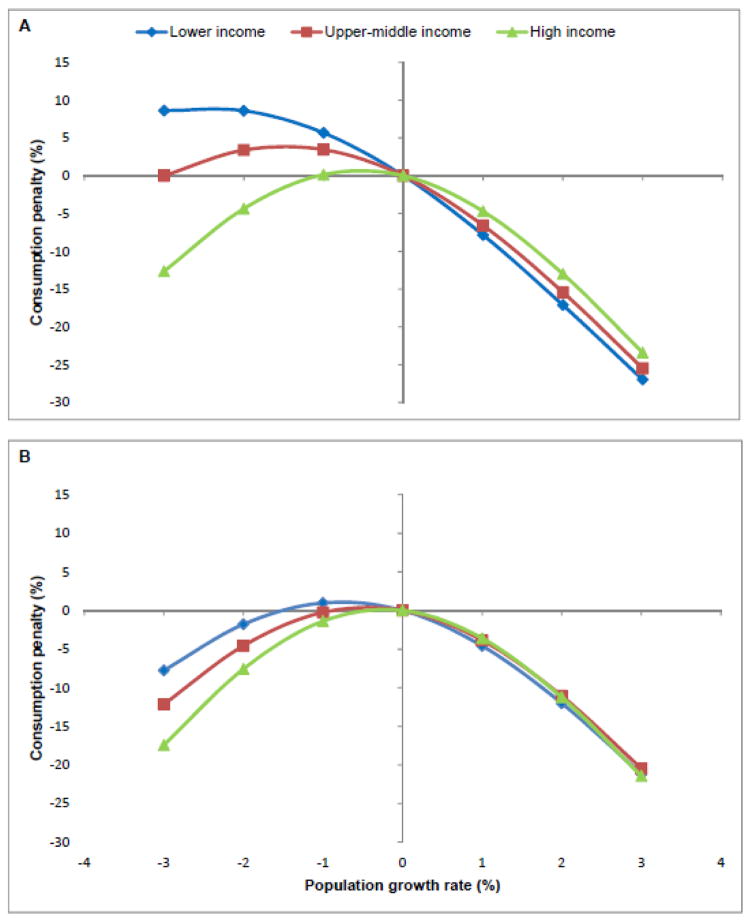
Longer lives and fertility far below the replacement level of 2.1 births per woman are leading to rapid population aging in many countries. Many observers are concerned that aging will adversely affect public finances and standards of living. Analysis of newly available National Transfer Accounts data for 40 countries shows that fertility well above replacement would typically be most beneficial for government budgets. However, fertility near replacement would be most beneficial for standards of living when the analysis includes the effects of age structure on families as well as governments. And fertility below replacement would maximize per capita consumption when the cost of providing capital for a growing labor force is taken into account. Although low fertility will indeed challenge government programs and very low fertility undermines living standards, we find that moderately low fertility and population decline favor the broader material standard of living.
Copyright © 2014, American Association for the Advancement of Science.
Figures
Comment in
-
Economics. Adjusting to the fertility bust.Science. 2014 Oct 10;346(6206):163-4. doi: 10.1126/science.1260504. Science. 2014. PMID: 25301602 Free PMC article. No abstract available.
References
-
- United Nations Department of Economic and Social Affairs: Population Division. World Population Prospects: The 2012 Revision. United Nations; New York: 2013.
-
- United Nations Department of Economic and Social Affairs: Population Division. World Population Policies Database 2013. United Nations; New York: 2013.
-
- Bloom DE, Canning D, Sevilla J. The Demographic Dividend: A New Perspective on the Economic Consequences of Population Change. RAND; Santa Monica, CA: 2002.
-
- Arthur WB, McNicoll G. Samuelson, population and intergenerational transfers. Int Ec Rev. 1978;19:241–246.
-
- Willis RJ. Life cycles, institutions and population growth: A theory of the equilibrium interest rate in an overlapping-generations model. In: Lee RD, Arthur WB, Rodgers G, editors. Economics of Changing Age Distributions in Developed Countries. Oxford Univ. Press; New York: 1988. pp. 106–138.
Publication types
MeSH terms
Grants and funding
LinkOut - more resources
Full Text Sources
Other Literature Sources
Medical
