. 2014 Oct 30;5(20):10070-83.
doi: 10.18632/oncotarget.2458.

The tyrosine phosphatase PTPRO sensitizes colon cancer cells to anti-EGFR therapy through activation of SRC-mediated EGFR signaling

Affiliations

The tyrosine phosphatase PTPRO sensitizes colon cancer cells to anti-EGFR therapy through activation of SRC-mediated EGFR signaling

Layka Abbasi Asbagh et al. Oncotarget. .

Abstract

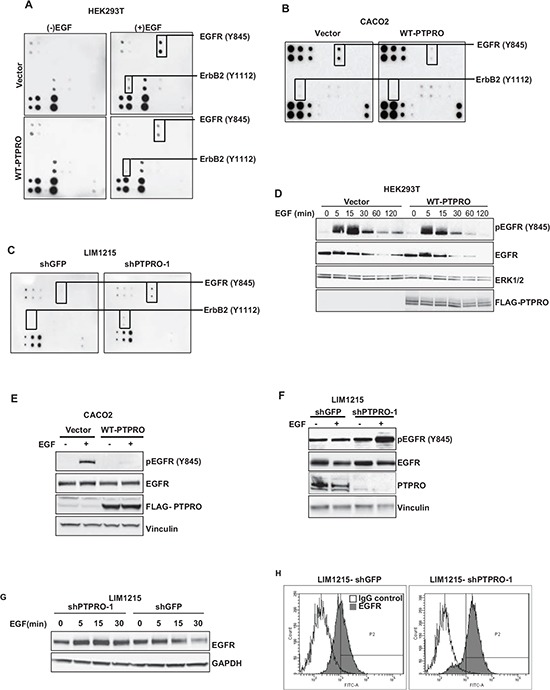
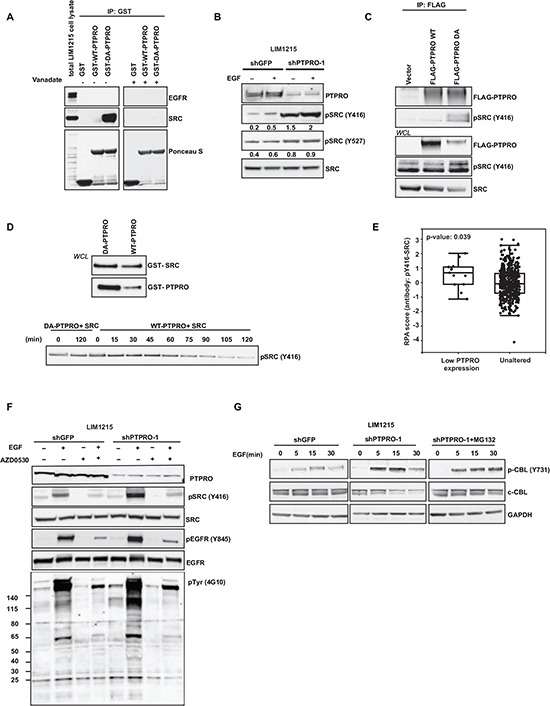
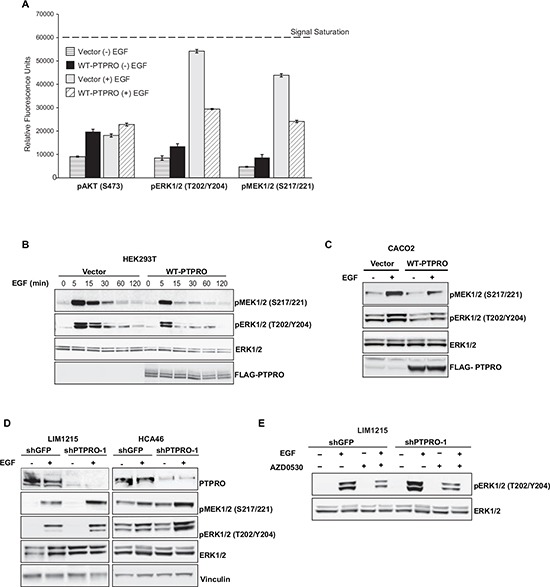
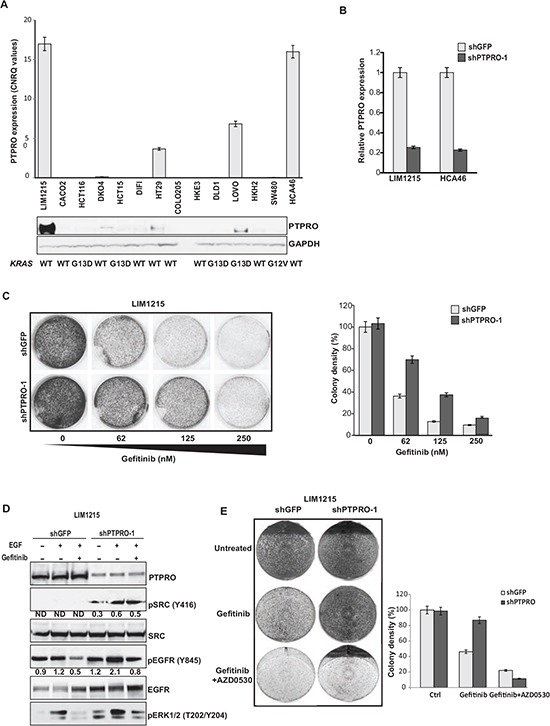
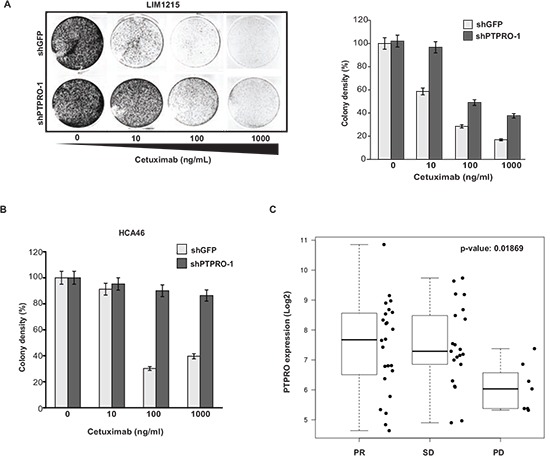
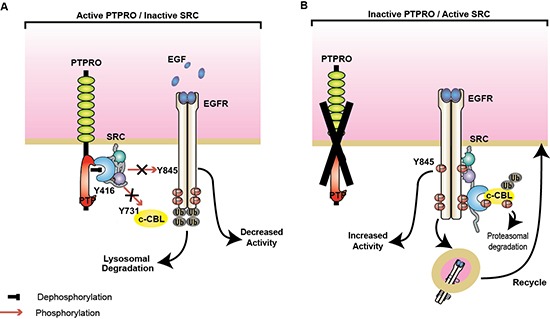
Inappropriate activation of epidermal growth factor receptor (EGFR) plays a causal role in many cancers including colon cancer. The activation of EGFR by phosphorylation is balanced by receptor kinase and protein tyrosine phosphatase activities. However, the mechanisms of negative EGFR regulation by tyrosine phosphatases remain largely unexplored. Our previous results indicate that protein tyrosine phosphatase receptor type O (PTPRO) is down-regulated in a subset of colorectal cancer (CRC) patients with a poor prognosis. Here we identified PTPRO as a phosphatase that negatively regulates SRC by directly dephosphorylating Y416 phosphorylation site. SRC activation triggered by PTPRO down-regulation induces phosphorylation of both EGFR at Y845 and the c-CBL ubiquitin ligase at Y731. Increased EGFR phosphorylation at Y845 promotes its receptor activity, whereas enhanced phosphorylation of c-CBL triggers its degradation promoting EGFR stability. Importantly, hyperactivation of SRC/EGFR signaling triggered by loss of PTPRO leads to high resistance of colon cancer to EGFR inhibitors. Our results not only highlight the PTPRO contribution in negative regulation of SRC/EGFR signaling but also suggest that tumors with low PTPRO expression may be therapeutically targetable by anti-SRC therapies.


Conflict of interest statement

Conflict of interest

The authors declare no conflict of interest.

Figures

Figure 1
Figure 1. PTPRO contributes to EGFR regulation
A, B The effect of PTPRO overexpression on EGFR phosphorylation. (A) Serum-starved (−EGF) HEK293T cells expressing either an empty vector, or WT-PTPRO were stimulated with EGF (100 ng/ml) for 15 minutes. Each dot represents specific tyrosine phosphorylation of EGFR family members at a specific site. (B) CACO2 cells expressing either an empty vector, or WT-PTPRO were serum-starved and then stimulated with EGF (20 ng/ml) for 15 minutes. (C) The effect of PTPRO suppression on EGFR phosphorylation. LIM1215 cells expressing the indicated construct were serum-starved overnight and stimulated with EGF (20 ng/ml) for 15 minutes. Each dot represents specific tyrosine phosphorylation of EGFR family members at a specific site. D, E, F Immunoblot analysis of total EGFR or EGFR phosphorylated at Y845. (D) Serum-starved HEK293T cells expressing the indicated constructs were stimulated with EGF (100 ng/ml) for different time points. (E) Serum-starved CACO2 cells expressing the indicated constructs were stimulated with EGF (20 ng/ml) for 15 min. (F) Serum-starved LIM1215 cells expressing either shPTPRO or shGFP were stimulated with EGF (20 ng/ml) for 15 min. (G) Immunoblot analysis of EGFR in LIM1215 cells expressing either shPTPRO, or shGFP. Cells were serum-starved overnight and stimulated with EGF (20 ng/ml) for the indicated time periods. (H) Flow cytometry analysis of cell-surface EGFR in LIM1215 cells expressing shRNAs against PTPRO or GFP. Cells were stained with FITC-conjugated anti-EGFR antibody or normal mouse IgG2 as a control.
Figure 2
Figure 2. PTPRO controls EGFR by directly dephosphorylating the SRC kinase
(A) PTPRO substrate-trapping assay. Cell lysates from pervanadate-treated LIM1215 cells were incubated with GSH-sepharose beads conjugated to GST-tagged catalytic domains of PTPRO (WT and DA) in the absence or presence of vanadate (1 mM). The pulled-down proteins were detected by immunoblotting with the indicated antibodies. The protein input was controlled with Ponceau S staining. (B) Immunoblot analysis of phospho-SRC and total SRC in serum-starved LIM1215 cells expressing shPTPRO or shGFP after 15 min of EGF stimulation (20 ng/ml). Levels of phosphorylated SRC normalized by total SRC expression were assessed by densitometry analysis using AIDA software. (C) Co-immunoprecipitation of Flag-tagged PTPRO (WT and DA) with SRC phosphorylated at Y416. 48 hours after overexpression with Flag-tagged forms of PTPRO (WT and DA), the indicated PTPRO constructs were pulled-down using anti-Flag agarose. Phospho-SRC (Y416) was detected by immunoblotting. (D) Purified GST-tagged catalytic domains of PTPRO (WT and DA) were incubated with GST-tagged recombinant active SRC kinase for different time points. Levels of SRC phosphorylated at Y416 were detected by immunoblotting. Equal loading of proteins was controlled by immunoblotting using GST specific antibody. (E) Boxplots of reverse phase protein array (RPPA) data showing phosphorylation status of SRC (Y416) in PTPRO down-regulated colorectal tumors. (F) Immunoblot analysis of the indicated proteins in LIM1215 cells expressing either shGFP or shPTPRO after treatment with AZD0530 (2μM) for 90 min in the presence or absence of EGF (20 ng/ml). (G) Immunoblot analysis of phospho-c-CBL (Y731) and c-CBL in LIM1215 cells expressing either shPTPRO or shGFP. Cells were serum-starved and stimulated with 20 ng/ml of EGF for the indicated time periods. MG-132 (10μM) was added to LIM1215-shPTPRO cells for 3 hours prior to EGF stimulation.
Figure 3
Figure 3. PTPRO inhibits EGF-dependent MAPK pathway activation
(A) Phosphorylation status of the indicated kinases measured by Collaborative Enzyme Enhance Reactive (CEER) immunoassay after overexpression of WT-PTPRO. Serum starved cells expressing PTPRO or an empty vector were analyzed after EGF stimulation (100 ng/ml) for 15 min. The results are expressed as mean ± s.e.m. for two independent experiments. (B) Immunoblot analysis of phospho-ERK1/2 and MEK1/2 in serum-starved HEK293T cells expressing an empty vector or WT-PTPRO at different time points after EGF stimulation (100 ng/ml). (C) Immunoblot analysis of phospho-ERK1/2 and MEK1/2 in serum-starved CACO2 cells expressing an empty vector or WT-PTPRO after EGF stimulation (20 ng/ml) for 15 min. (D) Immunoblot analysis of phospho-ERK1/2 and MEK1/2 in LIM1215 and HCA46 cells expressing either shPTPRO or shGFP. Cells were serum-starved and stimulated with EGF (20ng/ml) for 15 min. (E) Immunoblot analysis of phospo-ERK1/2 and total ERK1/2 in LIM1215 cells expressing the indicated vectors after treatment with AZD0530 (2μM) for 90 min in the presence or absence of EGF (20 ng/ml).
Figure 4
Figure 4. Resistance to gefitinib is associated with increased activation of EGFR and SRC in cells with low PTPRO expression
(A) qRT-PCR and immunoblot analyses of PTPRO expression in a panel of human CRC cell lines. (B) qRT-PCR analysis of PTPRO mRNA expression in LIM1215 and HCA-46 cells expressing shRNAs against GFP or PTPRO. (C) Colony formation assay of LIM1215 cells expressing shRNAs targeting PTPRO or GFP treated with increasing concentrations of gefitinib. (D) Immunoblot analysis of the indicated proteins in LIM1215 cells expressing either shGFP or shPTPRO after treatment with gefitinib (1μM) for 1hr in the presence or absence of EGF (20 ng/ml). Levels of phosphorylated SRC and EGFR normalized by total SRC or EGFR expression, respectively, were assessed by densitometry analysis using AIDA software. (E) Colony formation assay of LIM1215 cells expressing shGFP or shPTPRO treated with gefitinib (62nM) or a combination of gefitinib (62nM) and AZD0530 (1 μM). A, B, C The results are expressed as mean ± s.e.m. for three independent experiments. C, E Colony density was quantified using ImageJ software.
Figure 5
Figure 5. Loss of PTPRO expression leads to resistance to cetuximab
(A) Colony formation assay of LIM1215 cells expressing shRNAs targeting PTPRO or GFP treated with increasing concentrations of cetuximab. (B) Colony formation assay of HCA46 cells expressing shRNAs targeting PTPRO or GFP treated with increasing concentrations of cetuximab. (C) The boxplots showing log2 expression of PTPRO gene in the WT-KRAS population of primary CRC tumors from stage IV patients, according to the best response to cetuximab treatment (PR-partial response, SD - stable disease, PD - progressive disease). A, B The results are expressed as mean ± s.e.m. for three independent experiments. A, B Colony density was quantified using ImageJ software.
Figure 6
Figure 6. PTPRO negatively regulates SRC/EGFR signaling
(A) By directly dephosphorylating SRC at Y416, PTPRO inactivates SRC activity that blocks SRC-mediated EGFR phosphorylation at Y845 and c-CBL at Y731. Non-phosphorylated c-CBL triggers EGFR ubiquitination and lysosomal degradation. (B) Loss of PTPRO leads to SRC activation and accumulation of EGFR phosphorylated at Y845 and c-CBL at Y731. Phosphorylation of c-CBL promotes its proteasomal degradation and thereby active EGFR is recycling to the plasma membrane.

References

    1. Avraham R, Yarden Y. Feedback regulation of EGFR signalling: decision making by early and delayed loops. Nat Rev Mol Cell Biol. 2011;12:104–117. - PubMed
    1. Citri A, Yarden Y. EGF-ERBB signalling: towards the systems level. Nat Rev Mol Cell Biol. 2006;7:505–516. - PubMed
    1. Baselga J, Arteaga CL. Critical update and emerging trends in epidermal growth factor receptor targeting in cancer. J Clin Oncol. 2005;23:2445–2459. - PubMed
    1. Yarden Y, Pines G. The ERBB network: at last, cancer therapy meets systems biology. Nat Rev Cancer. 2012;12:553–563. - PubMed
    1. Berset TA, Hoier EF, Hajnal A. The C. elegans homolog of the mammalian tumor suppressor Dep-1/Scc1 inhibits EGFR signaling to regulate binary cell fate decisions. Genes Dev. 2005;19:1328–1340. - PMC - PubMed

Publication types

MeSH terms