. 2014 Oct 10:5:5208.
doi: 10.1038/ncomms6208.

Positive selection and compensatory adaptation interact to stabilize non-transmissible plasmids

Affiliations

Positive selection and compensatory adaptation interact to stabilize non-transmissible plasmids

A San Millan et al. Nat Commun. .

Abstract

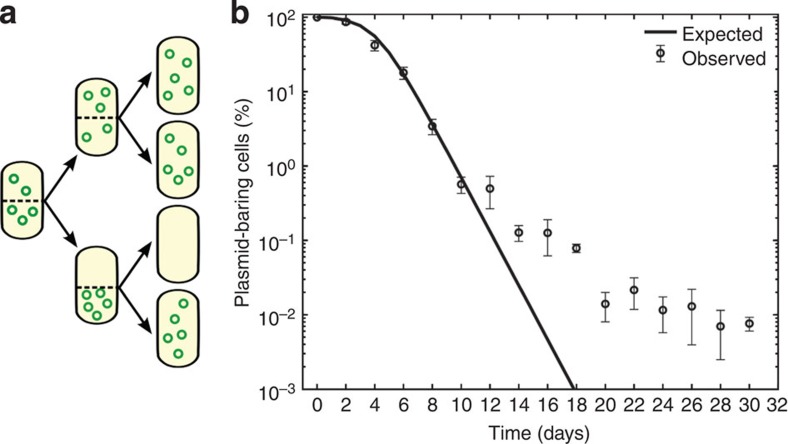
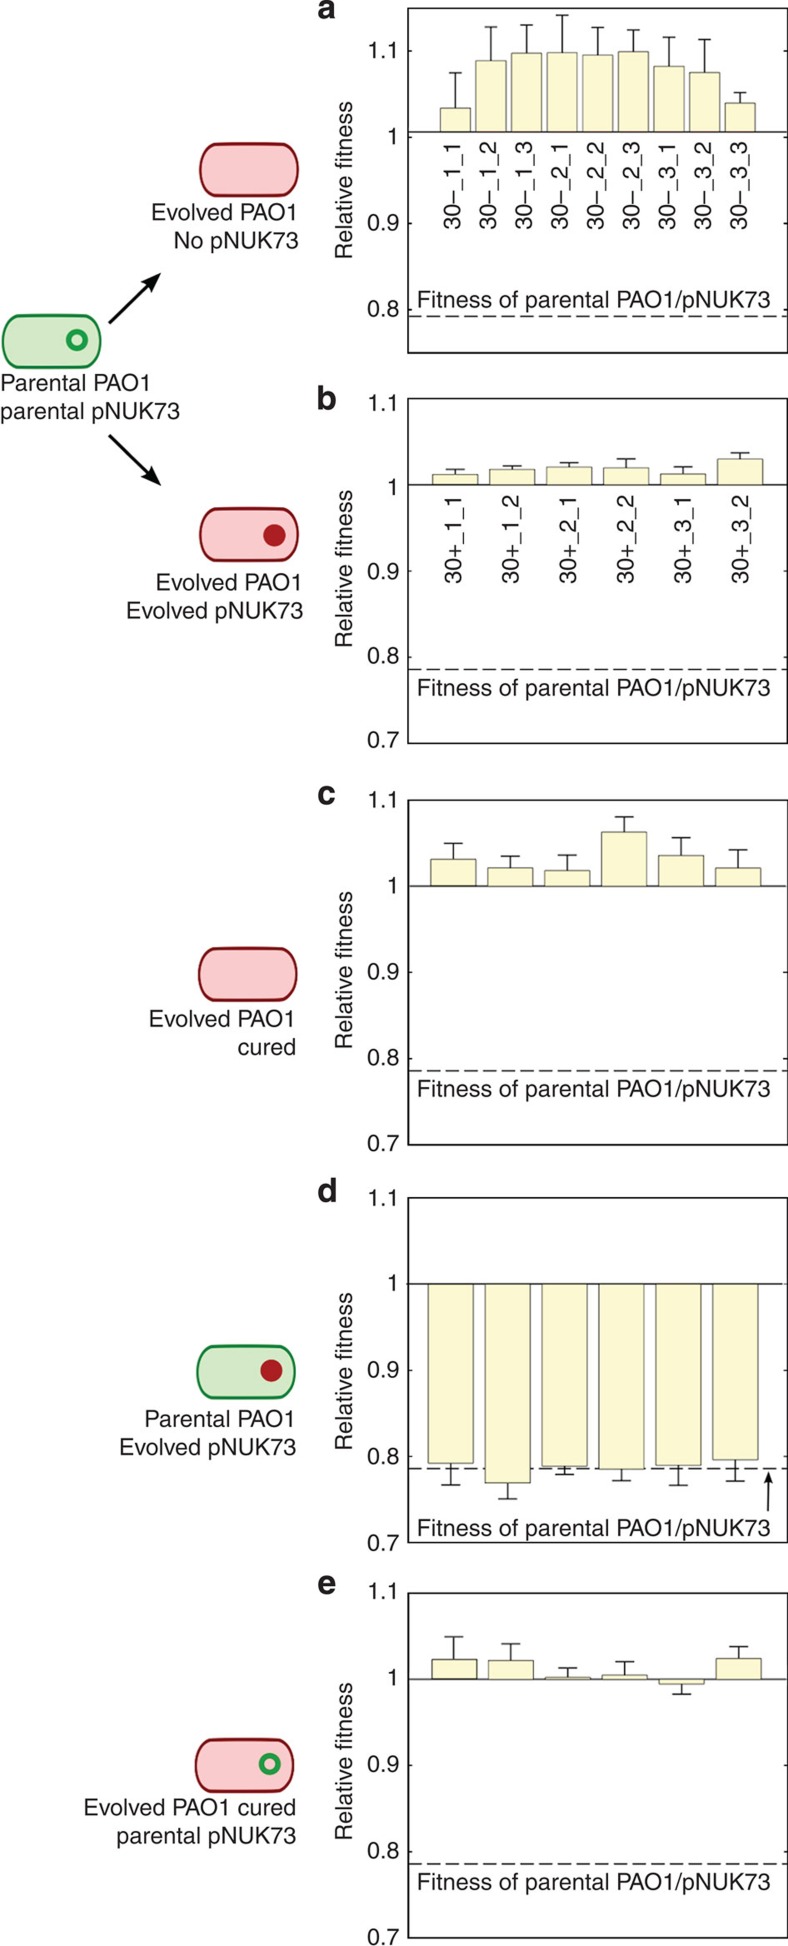
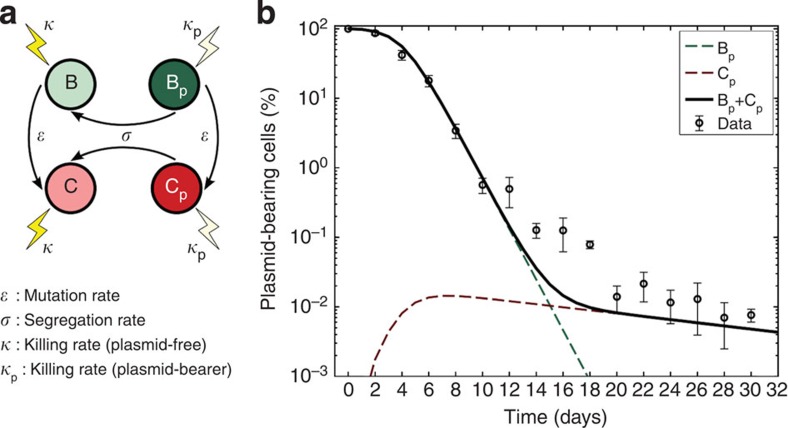
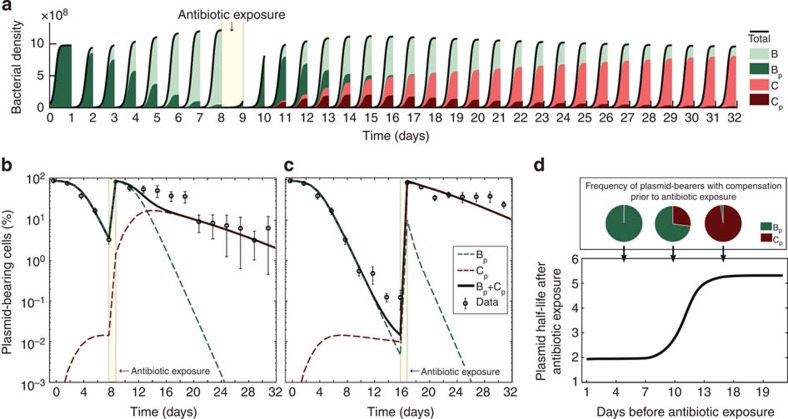
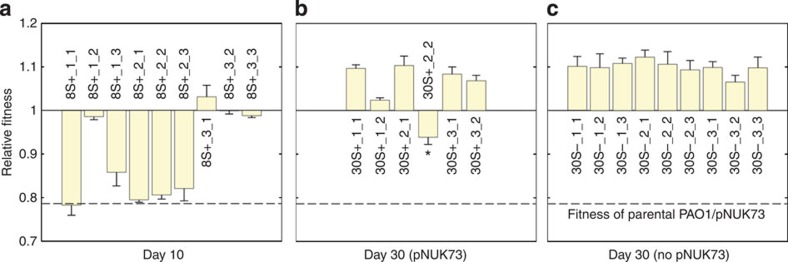
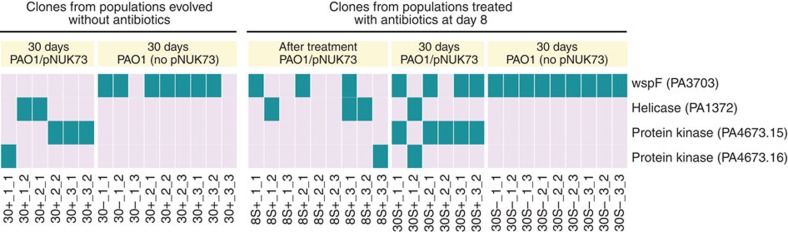
Plasmids are important drivers of bacterial evolution, but it is challenging to understand how plasmids persist over the long term because plasmid carriage is costly. Classical models predict that horizontal transfer is necessary for plasmid persistence, but recent work shows that almost half of plasmids are non-transmissible. Here we use a combination of mathematical modelling and experimental evolution to investigate how a costly, non-transmissible plasmid, pNUK73, can be maintained in populations of Pseudomonas aeruginosa. Compensatory adaptation increases plasmid stability by eliminating the cost of plasmid carriage. However, positive selection for plasmid-encoded antibiotic resistance is required to maintain the plasmid by offsetting reductions in plasmid frequency due to segregational loss. Crucially, we show that compensatory adaptation and positive selection reinforce each other's effects. Our study provides a new understanding of how plasmids persist in bacterial populations, and it helps to explain why resistance can be maintained after antibiotic use is stopped.


Figures

Figure 1
Figure 1. Stability of pNUK73 in the bacterial population.
(a) Diagram illustrating the probability of a daughter cell not receiving any plasmid during division assuming no active partitioning system and random division of the plasmids (b) Relative proportion of plasmid-bearing bacteria (logarithmic scale) as a function of time. Expected (solid line) and observed (circles, average±s.d., n=3) dynamics of loss of plasmid pNUK73 in the population. Note how the numerical simulations of the model capture with quantitative accuracy the first 10 days of the experiments, but predict very different dynamics than observed experimentally after 10 days.
Figure 2
Figure 2. Compensatory adaptation to pNUK73 is due to changes in the host bacteria.
Fitness (average±s.e.m., n=6), compared with the ancestral PAO1 of: (a) plasmid-free (three clones per population) and (b) plasmid-bearing clones (two clones per population) after 30 days of serial passage in the absence of antibiotics, (c) the cured clones from the evolved plasmid-bearing clones, (d) the parental PAO1 transformed with the six evolved pNUK73 plasmids and (e) the evolved cured clones transformed with the ancestral pNUK73. Note the small increase in fitness in the plasmid-free clones (a) and the compensation of the fitness cost produced by the plasmid (b) over the experiment. The plasmid produced no significant cost in the evolved clones (comparison between b and c) and the adaptation was due to changes in the bacterial host chromosome (comparison among the ancestral PAO1/pNUK73, b and e) and not in pNUK73 (comparison among the ancestral PAO1/pNUK73, b and d). The names of the clones are displayed in the x-axis and clones are arranged according to populations.
Figure 3
Figure 3. Compensatory adaptation stabilizes pNUK73 in the bacterial population.
(a) Diagram illustrating the evolutionary dynamics of the model described in the methods section. (b) Relative proportion of plasmids-bearing bacteria (logarithmic scale) as a function of time. The solid black line represents the total expected frequency of plasmid bearers, while the red- and green-dotted lines denote the expected frequency of plasmid-bearing cells with and without the compensatory mutation. Circles represent the observed frequency of plasmid-bearing cells over time (average±s.d., n=3). Note that the predicted stabilization at the end of the experiment is a consequence of the compensated plasmid-bearing population having a higher fitness than the original parental strain and matches the experimental results.
Figure 4
Figure 4. Compensatory adaptation and positive selection interact to stabilize the plasmid.
(a) Simulated bacterial densities as a function of time in an experiment of duration 32 days, with drug deployed at day 8. The colour of each area denotes the frequency of each sub-population: plasmid-bearing parental strain in dark green, plasmid-free parental in light green, compensated plasmid-bearer in dark red and compensated plasmid-free in light red. (b,c) Relative proportion of plasmid-bearing bacteria (logarithmic scale) as a function of time. The solid black line represents the total expected frequency of plasmid bearers, while the red- and green-dotted lines denote the expected frequency of plasmid-bearing cells with and without the compensatory mutation. Circles represent the observed frequency of plasmid-bearing cells over time (average±s.d., n=3). Note how after antibiotic exposure at day 8 (b) or 16 (c) the plasmid-bearing population returns to 100% but with a different expected population structure than at the beginning of the experiment, and there is decay in the rate of plasmid loss in the population. (d) Expected plasmid half-life after antibiotic exposure as a function of the number of days elapsed before a single-day of antibiotic is used. If the drug is used early, then the population is composed mainly of the ancestral strain (illustrated in green in the pie chart above), while if there is a large delay before using the antibiotic then the plasmid becomes more stable because the population is now mostly composed of the compensated bacterial type (in red).
Figure 5
Figure 5. Relative fitness of clones from populations treated with neomycin.
Fitness (average±s.e.m., n=6), compared with the ancestral PAO1, of (a) nine plasmid-bearing clones (three per population) after one step of selection with neomycin from day 8 to 9, and (b) six plasmid-bearing clones (two per population) and (c) nine plasmid-free clones (three per population) from the same populations at day 30. Note that, as predicted by the model, immediately after antibiotic exposure (day 10) the population is composed both of PAO1/pNUK73 clones with the compensation and with a relative fitness similar to that of the parental. At the end of the experiment, however, all the plasmid-bearing clones have had a fitness cost compensatory mutation. Note that one of the plasmid-bearing clones at day 30 is marked with a star (30S+_2_2). This clone was excluded from the statistical analyses due to discrepancies between the fitness measurements in tubes and 96-well plates. The names of the clones are displayed in the x-axis and clones are arranged according to populations.
Figure 6
Figure 6. Common mutations in the clones of this study.
This figure shows the distribution of mutations in the four most commonly targeted genes in this study across the clones that we assayed. Note that mutations in the putative helicase (PA1372) and the two putative kinases (PA4673.15-16) are only present in plasmid-bearing clones and are responsible for the compensation for the plasmid cost. The names of the clones are displayed in the x-axis and clones are arranged according to populations.

References

    1. Summers D. K. The Biology of Plasmids Blackwell Science Ltd (1996).
    1. Gogarten J. P. & Townsend J. P. Horizontal gene transfer, genome innovation and evolution. Nat. Rev. Microbiol. 3, 679–687 (2005). - PubMed
    1. Alekshun M. N. & Levy S. B. Molecular mechanisms of antibacterial multidrug resistance. Cell 128, 1037–1050 (2007). - PubMed
    1. eCDC. European Center for Disease Prevention and Control. Annual Epidemiological Report 2012. http://www.ecdc.europa.eu/en/publications/surveillance_reports/Pages/ind... (2013).
    1. CDC. Centers for Disease Control and Prevention. Antibiotic resistance threats in the United States. http://www.cdc.gov/drugresistance/threat-report-2013/ (2013).

Publication types

MeSH terms

Substances

LinkOut - more resources