

Cartilaginous end plates: Quantitative MR imaging with very short echo times-orientation dependence and correlation with biochemical composition
- PMID: 25302832
- PMCID: PMC4314292
- DOI: 10.1148/radiol.14141082
Cartilaginous end plates: Quantitative MR imaging with very short echo times-orientation dependence and correlation with biochemical composition
Abstract
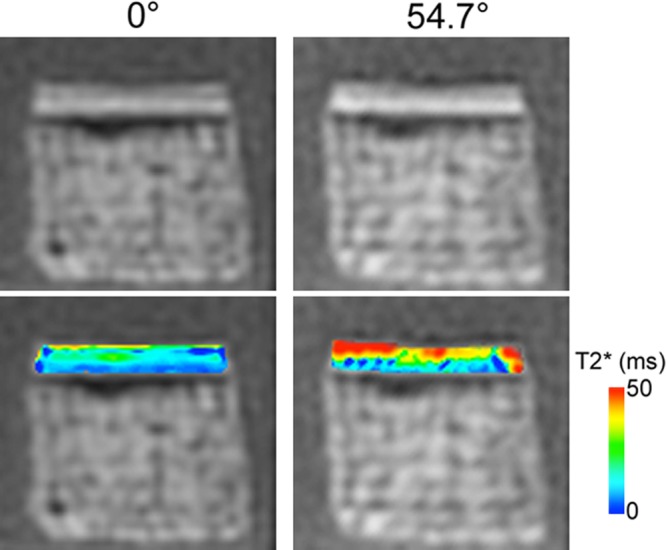
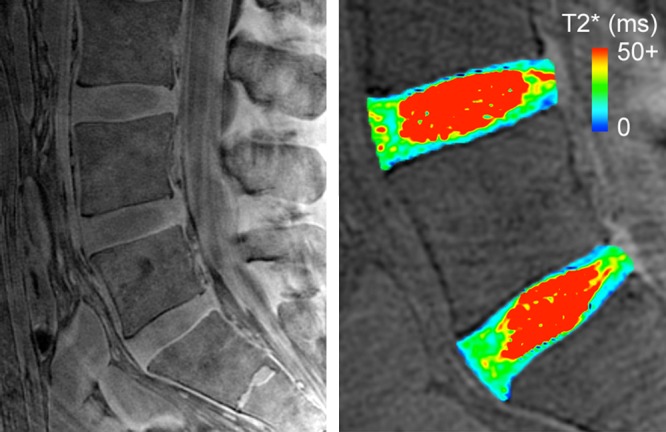
Purpose: To measure the T2* of the human cartilaginous end plate by using magnetic resonance (MR) imaging with very short echo times and to determine the effect of the orientation of the end plate on T2* and on relationships between T2* and biochemical composition.
Materials and methods: This study was exempt from institutional review board approval, and informed consent was not required. Thirty-four samples of three cadaveric lumbar spines (from subjects who died at ages 51, 57, and 66 years) containing cartilaginous end plates and subchondral bone were prepared. Samples were imaged with a 3-T imager for T2* quantification by using a three-dimensional very short echo time sequence (repetition time msec/echo times msec, 30/0.075, 2, 5, 12, 18). Samples were imaged with the end plate at three orientations with respect to the constant magnetic induction field: 0°, 54.7°, and 90°. After imaging, the cartilage was assayed for its water, glycosaminoglycan, and collagen content. Pearson correlations were used to investigate the effect of orientation on the relationships between T2* and biochemical composition.
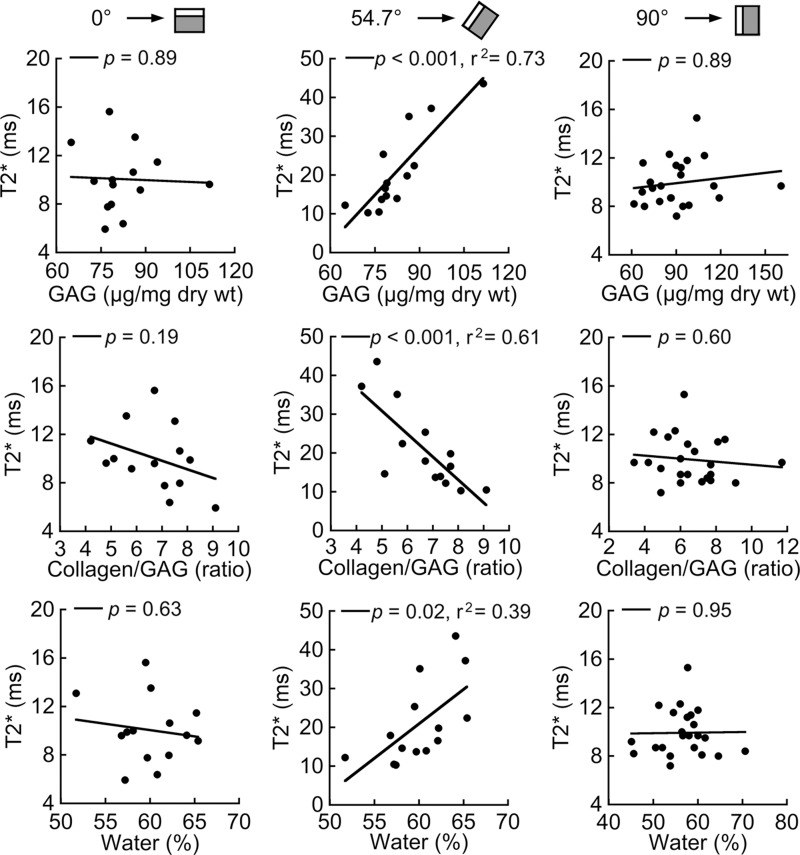
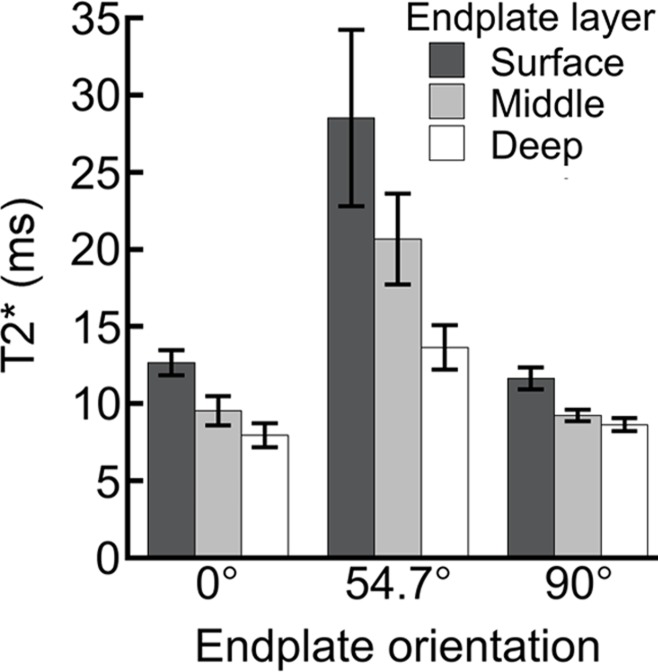
Results: T2* was significantly longer when measured at an orientation of 54.7° (21.8 msec ± 2.8 [± standard error of the mean]) than at 0° (10.0 msec ± 0.7, P < .001) or 90° (9.9 msec ± 0.4, P < .001). At 54.7°, T2* was highly correlated with glycosaminoglycan content (r = 0.85, P < .001), the collagen-to-glycosaminoglycan ratio (r = -0.79, P < .001), and water content (r = 0.62, P = .02); at 0° and 90°, there were no significant differences in these relationships, with a minimum P value of .19.
Conclusion: T2* evaluation can allow noninvasive estimation of the degeneration of the cartilaginous end plate; however, the accuracy of T2*-based estimates of biochemical composition depends on the orientation of the end plate.
© RSNA, 2014.
Figures
References
-
- Adams MA, Freeman BJ, Morrison HP, Nelson IW, Dolan P. Mechanical initiation of intervertebral disc degeneration. Spine 2000;25(13):1625–1636. - PubMed
-
- Urban JP, Holm S, Maroudas A, Nachemson A. Nutrition of the intervertebral disk. An in vivo study of solute transport. Clin Orthop Relat Res 1977;(129):101–114. - PubMed
-
- Brown MF, Hukkanen MV, McCarthy ID, et al. . Sensory and sympathetic innervation of the vertebral endplate in patients with degenerative disc disease. J Bone Joint Surg Br 1997;79(1):147–153. - PubMed
-
- Ohtori S, Inoue G, Ito T, et al. . Tumor necrosis factor-immunoreactive cells and PGP 9.5-immunoreactive nerve fibers in vertebral endplates of patients with discogenic low back Pain and Modic Type 1 or Type 2 changes on MRI. Spine 2006;31(9):1026–1031. - PubMed
Publication types
MeSH terms
Substances
Grants and funding
LinkOut - more resources
Full Text Sources
Other Literature Sources
Medical
