

Local and systemic effects of cat allergen nasal provocation
- PMID: 25303516
- PMCID: PMC4778413
- DOI: 10.1111/cea.12434
Local and systemic effects of cat allergen nasal provocation
Abstract
Background: Cat allergen is widely distributed in homes and schools; allergic sensitization is common.
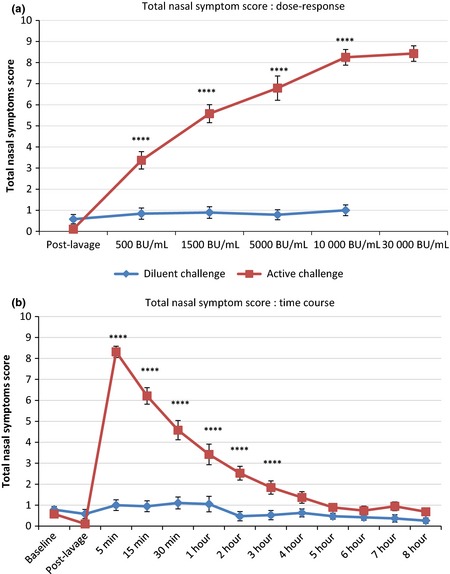
Objective: To develop a model of cat allergen nasal challenge to establish dose-response and time-course characteristics and investigate local and systemic biomarkers of allergic inflammation.
Methods: Nineteen cat-allergic individuals underwent titrated nasal challenge, range 0.243 to 14.6 μg/mL Fel d1, and matched diluent-only provocation. Clinical response to 8 h was assessed by symptom scores and peak nasal inspiratory flow (PNIF). Nasal fluid was collected using polyurethane sponges and analysed by ImmunoCAP and multiplex assays. Whole blood flow cytometry for basophil surface CD63, CD107a, and CD203c was carried out at baseline and 6 h post-challenge.
Results: A dose-response to allergen was seen in symptom scores and PNIF, maximal at 10 000 BU/mL (4.87 μg/mL Fel d1), P < 0.0001 vs. diluent. Nasal fluid tryptase was elevated at 5 min after challenge (P < 0.05 vs. diluent); eotaxin, IL-4, -5, -9, and -13 were increased at 8 h (P < 0.05 to P < 0.0001 vs. diluent); TSLP was undetectable; IL-10, IL-17A, and IL-33 were unchanged compared to diluent challenge. Nasal fluid IL-5 and IL-13 correlated inversely with PNIF after challenge (IL-5, r = -0.79, P < 0.0001; IL-13, r = -0.60, P = 0.006). Surface expression of CD63 and CD107a was greater at 6 h than at baseline, both in the presence (both P < 0.05) and absence (CD63, P < 0.01; CD107a, P < 0.05) of in vitro allergen stimulation; no changes were seen on diluent challenge day.
Conclusions: Cat allergen nasal challenge produces local and systemic Th2-driven inflammatory responses and has potential as a surrogate outcome measure in clinical trials.
Keywords: basophil; cat allergy; cytokine; nasal allergen challenge; tryptase.
© 2014 John Wiley & Sons Ltd.
Figures


References
-
- Bollinger ME, Wood RA, Chen P, Eggleston PA. Measurement of cat allergen levels in the home by use of an amplified ELISA. J Allergy Clin Immunol 1998; 101:124–5. - PubMed
-
- Arbes SJ, Sever M, Mehta J, Collette N, Thomas B, Zeldin DC. Exposure to indoor allergens in day‐care facilities: results from 2 North Carolina counties. J Allergy Clin Immunol 2005; 116:133–9. - PubMed
-
- Almqvist C, Larsson PH, Egmar AC, Hedrén M, Malmberg P, Wickman M. School as a risk environment for children allergic to cats and a site for transfer of cat allergen to homes. J Allergy Clin Immunol 1999; 103:1012–7. - PubMed
-
- Almqvist C, Wickman M, Perfetti L et al Worsening of asthma in children allergic to cats, after indirect exposure to cat at school. Am J Respir Crit Care Med 2001; 163:694–8. - PubMed
-
- Arbes SJ Jr, Gergen PJ, Elliott L, Zeldin DC. Prevalences of positive skin test responses to 10 common allergens in the US population: results from the third National Health and Nutrition Examination Survey. J Allergy Clin Immunol 2005; 116:377–83. - PubMed
Publication types
MeSH terms
Substances
Grants and funding
LinkOut - more resources
Full Text Sources
Other Literature Sources
Medical
Miscellaneous
