

doi: 10.1093/neuonc/nou223.
CBTRUS statistical report: primary brain and central nervous system tumors diagnosed in the United States in 2007-2011
Affiliations
- PMID: 25304271
- PMCID: PMC4193675
- DOI: 10.1093/neuonc/nou223
Item in Clipboard
CBTRUS statistical report: primary brain and central nervous system tumors diagnosed in the United States in 2007-2011
Neuro Oncol.
2014 Oct.
No abstract available
Figures
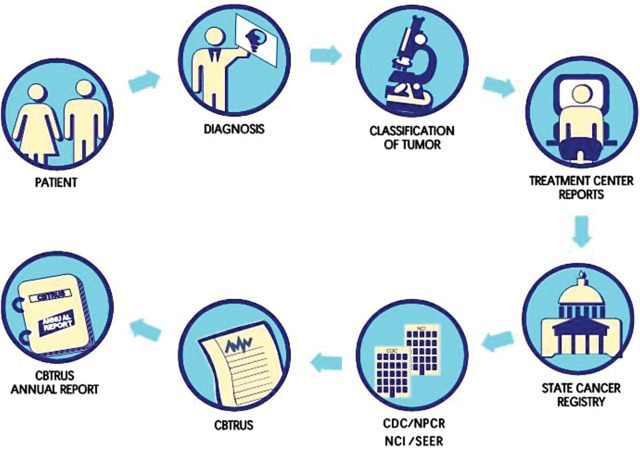
Schematic of Cancer Registration Process for CBTRUS Reporting.
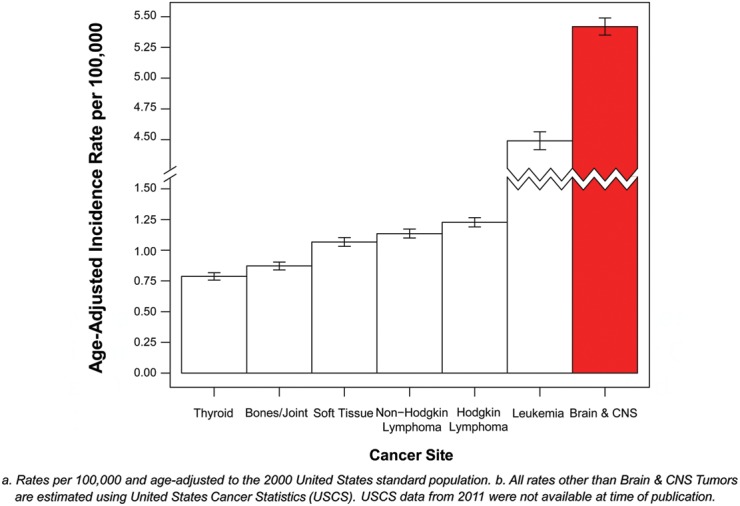
Average Annual Age-Adjusted Incidence Ratesa of All Primary Brain and CNS Tumors in Comparison to Other Common Cancers in Children and Adolescents (Ages 0–19), CBTRUS Statistical Report: NPCR and SEER 2007–2011, USCS 2007–2010b.
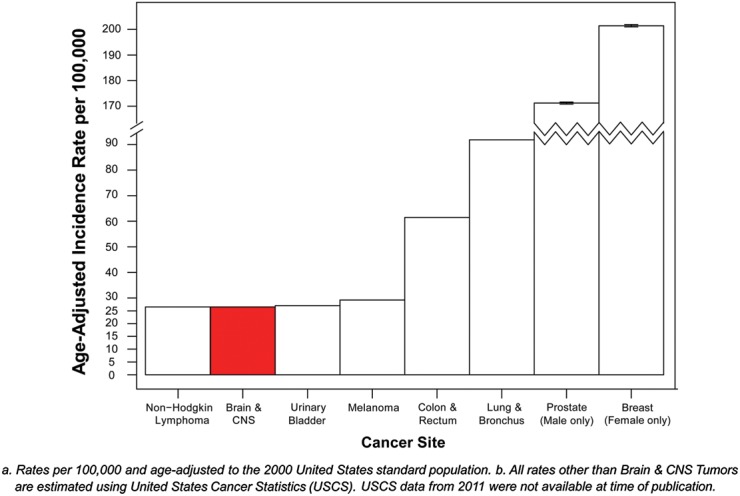
Average Annual Age-Adjusted Incidence Ratesa of All Primary Brain and CNS Tumors in Comparison to Other Cancers in Adults (Ages 20 +), CBTRUS Statistical Report: NPCR and SEER 2007–2011, USCS 2007–2010b.
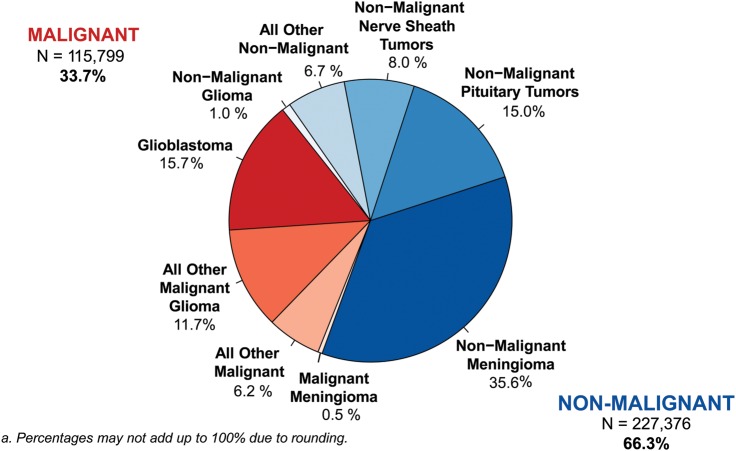
Distributiona of Primary Brain and CNS Tumors by Behavior (N = 343,175), CBTRUS Statistical Report: NPCR and SEER, 2007–2011.
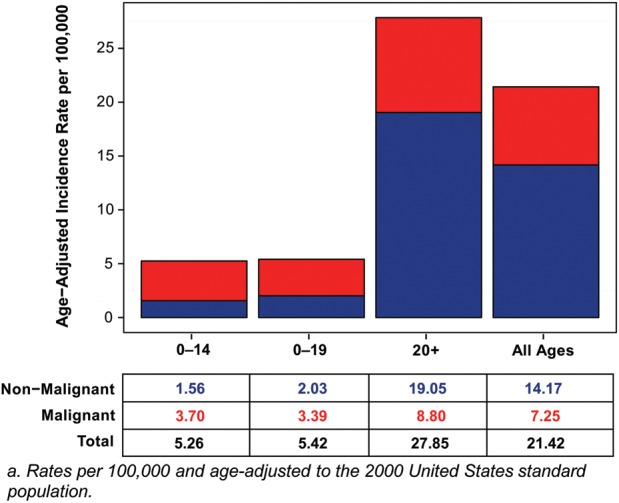
Average Annual Age-Adjusted Incidence Ratesa of Primary Brain and CNS Tumors by Age and Behavior, CBTRUS Statistical Report: NPCR and SEER, 2007–2011.
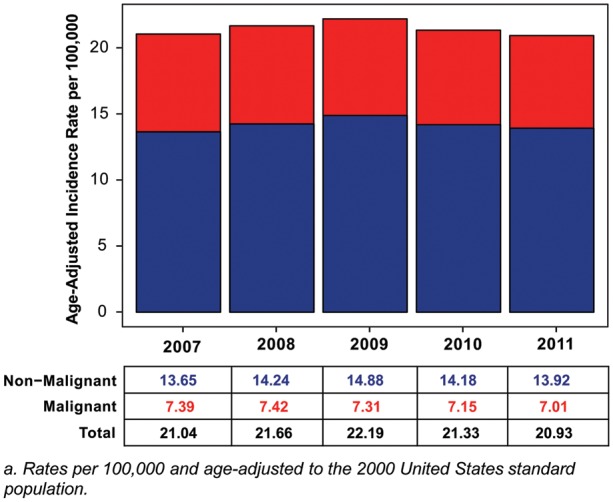
Annual Age-Adjusted Incidence Ratesa of Primary Brain and CNS Tumors by Year and Behavior, CBTRUS Statistical Report: NPCR and SEER, 2007–2011.
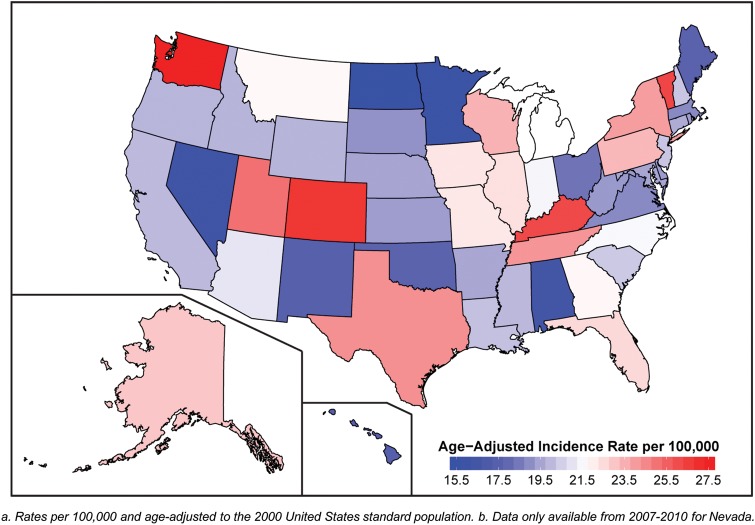
Average Annual Age-Adjusted Incidence Ratesa of All Primary Brain and CNS Tumors by Central Cancer Registry, CBTRUS Statistical Report: NPCR and SEER, 2007–2011b.
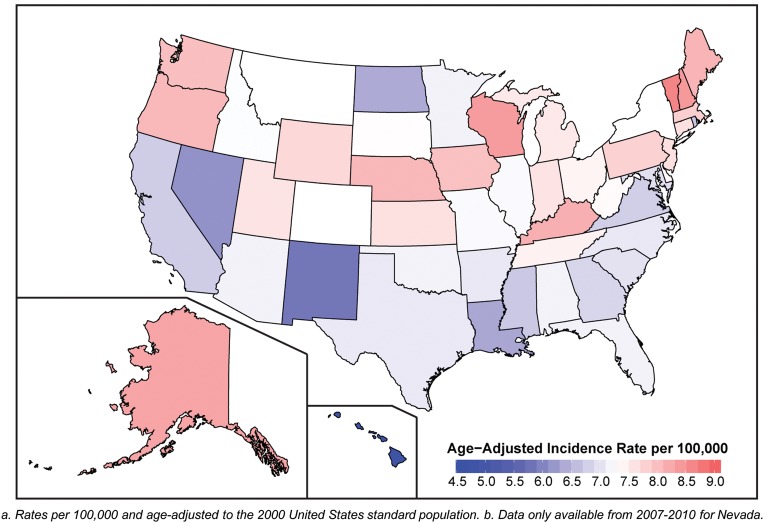
Average Annual Age-Adjusted Incidence Ratesa of Malignant Primary Brain and CNS Tumors by Central Cancer Registry, CBTRUS Statistical Report: NPCR and SEER, 2007–2011b.
Average Annual Age-Adjusted Incidence Ratesa of Non-Malignant Primary Brain and CNS Tumors by Central Cancer Registry, CBTRUS Statistical Report: NPCR and SEER, 2007–2011b.
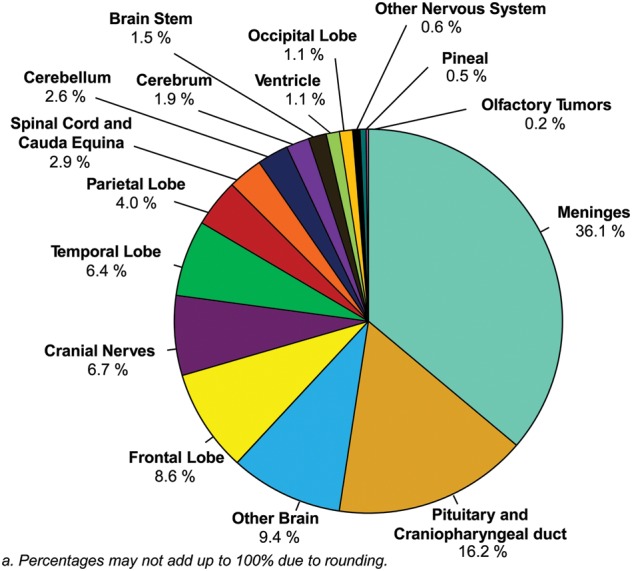
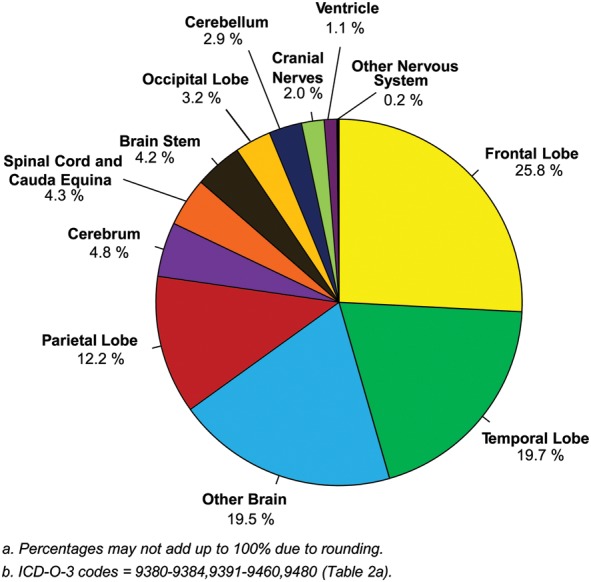
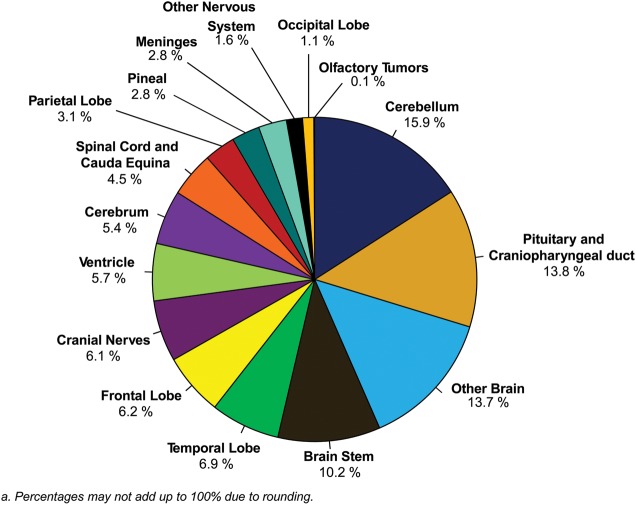
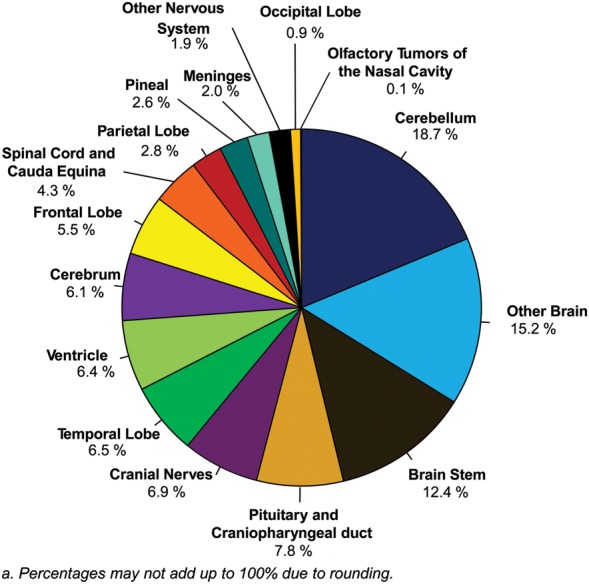
Distributiona of All Primary Brain and CNS Tumors by Site (N = 343,175), CBTRUS Statistical Report: NPCR and SEER, 2007–2011.
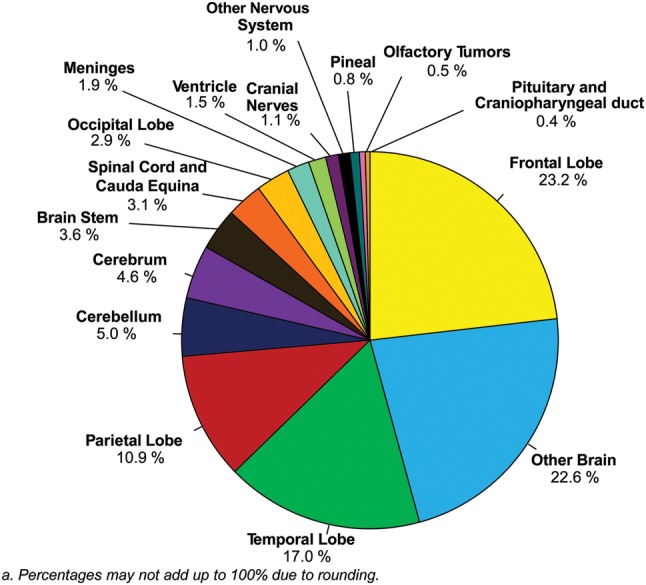
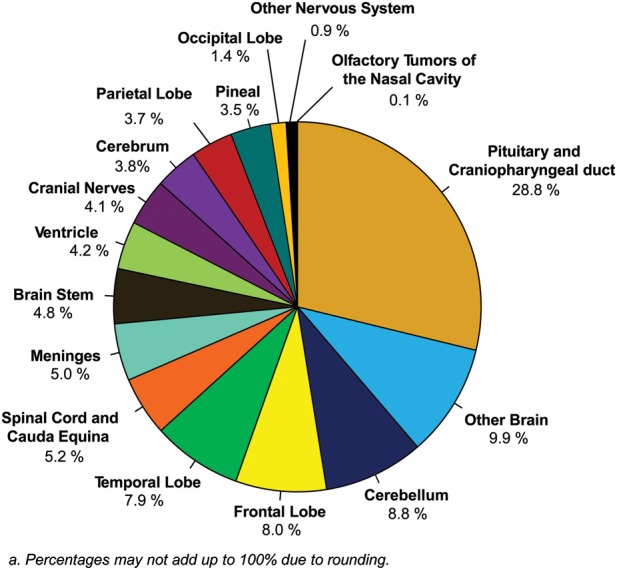
Distributiona of Malignant Primary Brain and CNS Tumors by Site (N = 115,799), CBTRUS Statistical Report: NPCR and SEER, 2007–2011.
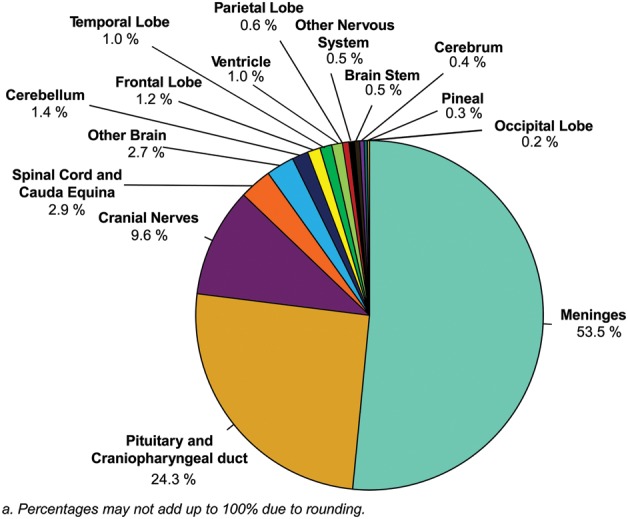
Distributiona of Non-Malignant Primary Brain and CNS Tumors by Site (N = 227,376), CBTRUS Statistical Report: NPCR and SEER, 2007–2011.
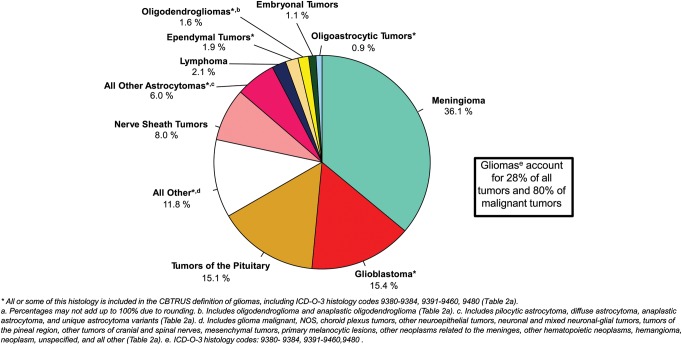
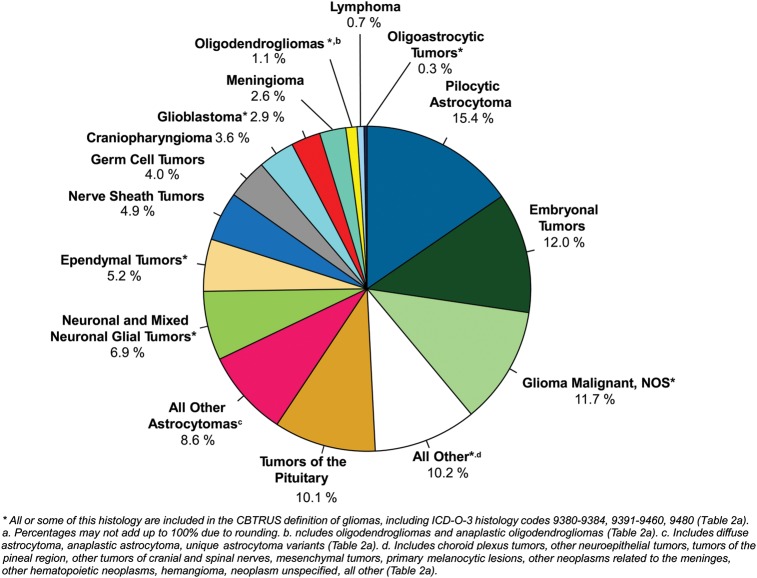
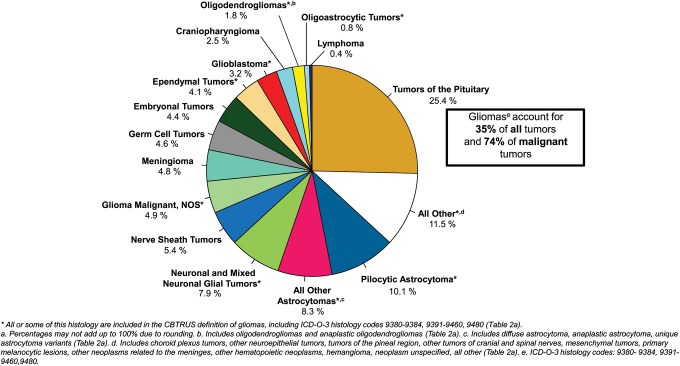
Distributiona of All Primary Brain and CNS Tumors by CBTRUS Histology Groupings and Histology (N = 343,175), CBTRUS Statistical Report: NPCR and SEER, 2007–2011.
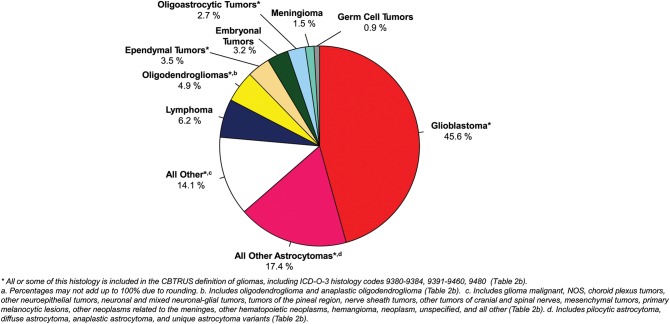
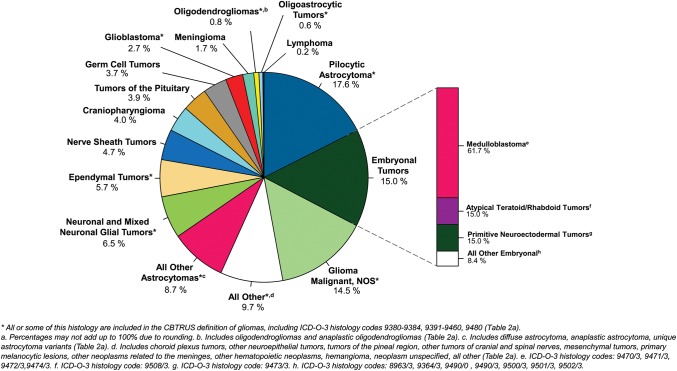
Distributiona of Malignant Primary Brain and CNS Tumors by CBTRUS Histology Groupings and Histology (N = 115,799), CBTRUS Statistical Report: NPCR and SEER, 2007–2011.
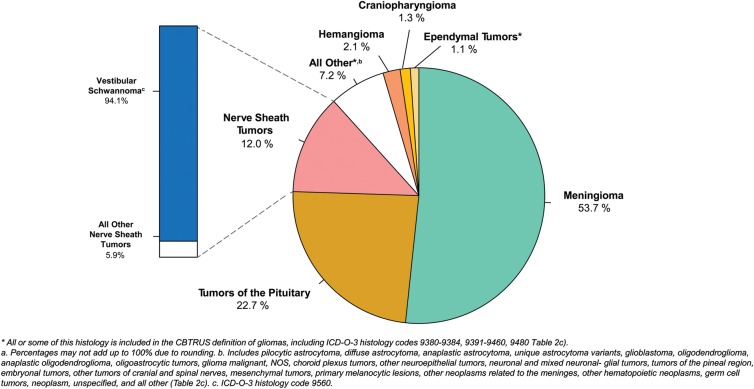
Distributiona of Non-Malignant Primary Brain and CNS Tumors by CBTRUS Histology Groupings and Histology (N = 227,376), CBTRUS Statistical Report: NPCR and SEER, 2007–2011.
Distributiona of Primary Brain and CNS Gliomasb by Site (N = 96,448), CBTRUS Statistical Report: NPCR and SEER, 2007–2011.
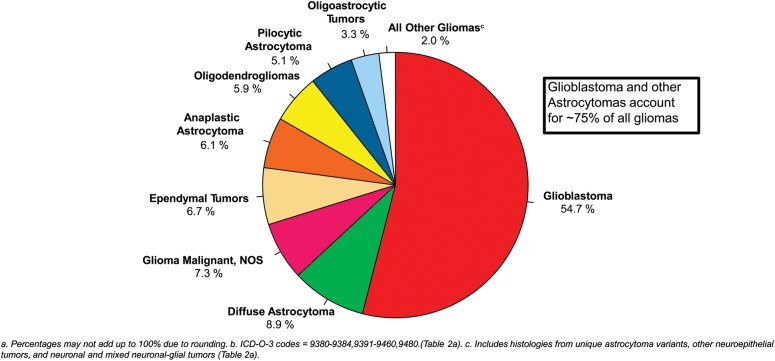
Distributiona of Primary Brain and CNS Gliomasb by Histology Subtypes (N = 96,448), CBTRUS Statistical Report: NPCR and SEER, 2007–2011.
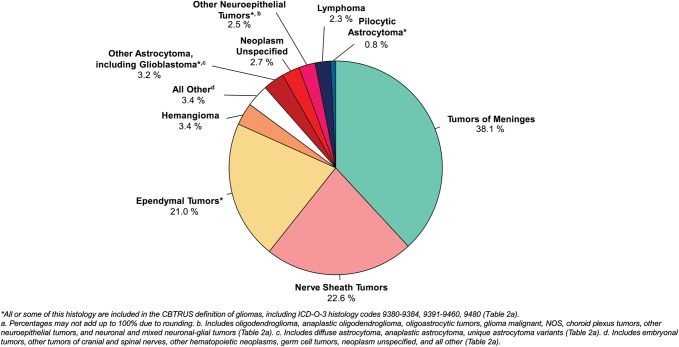
Distributiona of Spinal Cord, Spinal Meninges, and Cauda Equina Tumors in Children and Adolescents (Ages 0–19), CBTRUS Histology Groupings, and Histology (N = 1,238), CBTRUS Statistical Report: NPCR and SEER, 2007–2011.
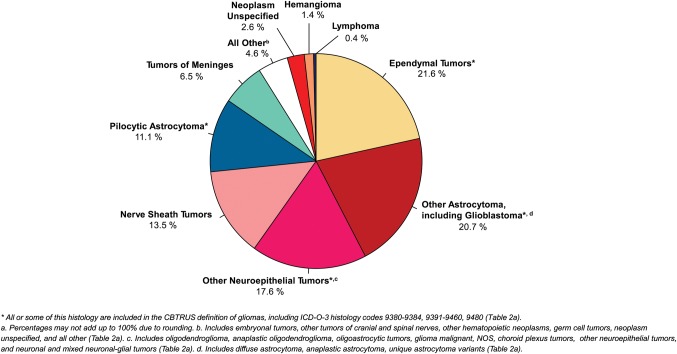
Distributiona of Spinal Cord, Spinal Meninges, and Cauda Equina Tumors in Adults (Ages 20+), CBTRUS Histology Groupings, and Histology (N = 14,822), CBTRUS Statistical Report: NPCR and SEER, 2007–2011.
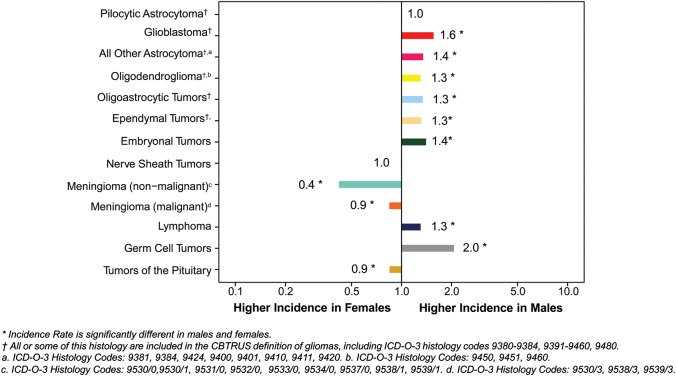
Incidence Rate Ratios by Gender (Males:Females) for Selected CBTRUS Histology Groupings and Histology, CBTRUS Statistical Report: NPCR and SEER, 2007–2011.
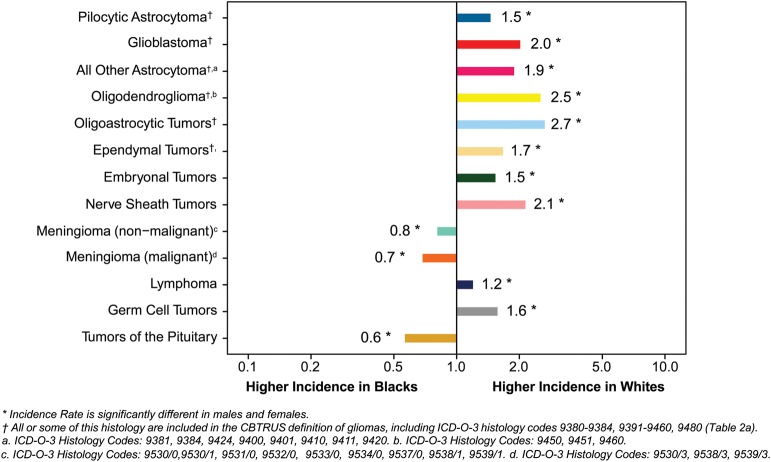
Incidence Rate Ratios by Race (Whites:Blacks) for Selected CBTRUS Histology Groupings and Histologies, CBTRUS Statistical Report: NPCR and SEER, 2007–2011.
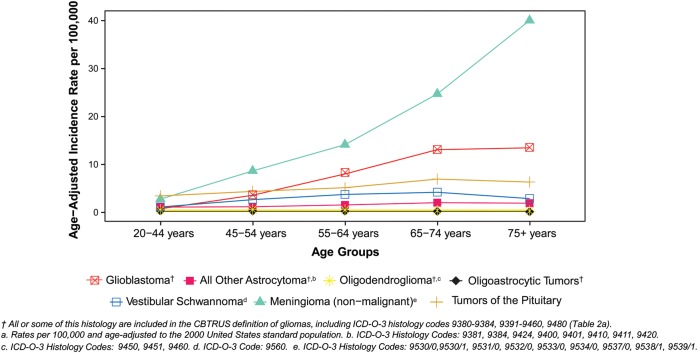
Age-Adjusted Incidence Ratesa of Brain and CNS Tumors by Selected Histologies and Age Groups (Ages 20+), CBTRUS Statistical Report: NPCR and SEER, 2007–2011.
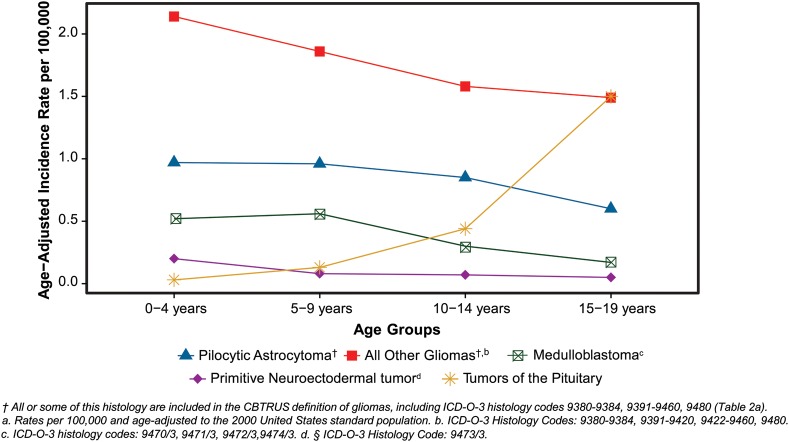
Age-Adjusted Incidence Ratesa in Children and Adolescents of Brain and CNS Tumors by Selected Histologies and Age Groups (Ages 0–19), CBTRUS Statistical Report: NPCR and SEER, 2007–2011.
Distributiona in Children and Adolescents (Ages 0–19) of Primary Brain and CNS Tumors by Site (N = 22,535), CBTRUS Statistical Report: NPCR and SEER, 2007–2011.
Distributiona in Children and Adolescents (Ages 0–19) of Primary Brain and CNS Tumors by CBTRUS Histology Groupings and Histology (N = 22,535), CBTRUS Statistical Report: NPCR and SEER, 2007–2011.
Distributiona in Children (Ages 0–14) of Primary Brain and CNS Tumors by Site (N = 16,044), CBTRUS Statistical Report: NPCR and SEER, 2007–2011.
Distributiona in Children (Ages 0–14) of Primary Brain and CNS Tumors by CBTRUS Histology Groupings and Histology (N = 16,044), CBTRUS Statistical Report: NPCR and SEER, 2007–2011.
Distributiona in Adolescents (Ages 15–19) of Primary Brain and CNS Tumors by Site (N = 6,491), CBTRUS Statistical Report: NPCR and SEER, 2007–2011.
Distributiona in Adolescents (Ages 15–19) of Primary Brain and CNS Tumors by Histology (N = 6,491), CBTRUS Statistical Report: NPCR and SEER, 2007–2011.

Average Annual Age-Adjusted Mortality Rates for Malignant Primary Brain and CNS Tumors by Central Cancer Registry, CBTRUS Statistical Report: NCHS, 2007–2011.
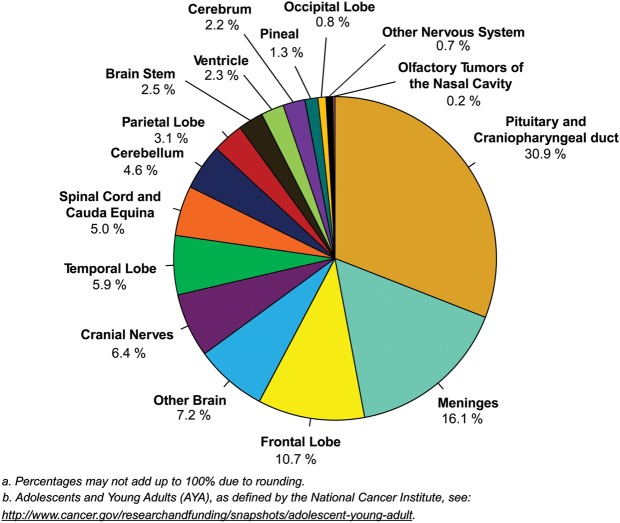
Distributiona in Adolescents and Young Adultsb (Ages 15–39) of Primary Brain and CNS Tumors by Site (N = 51,118), CBTRUS Statistical Report: NPCR and SEER, 2007–2011.
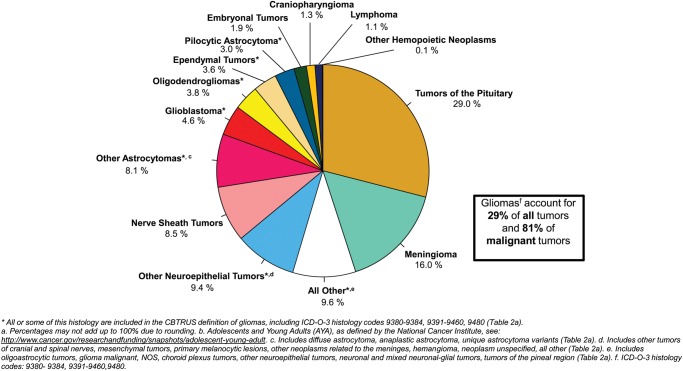
Distributiona in Adolescents and Young Adultsb (Ages 15–39) of Primary Brain and CNS Tumors by Histology (N = 51,118), CBTRUS Statistical Report: NPCR and SEER, 2007–2011.
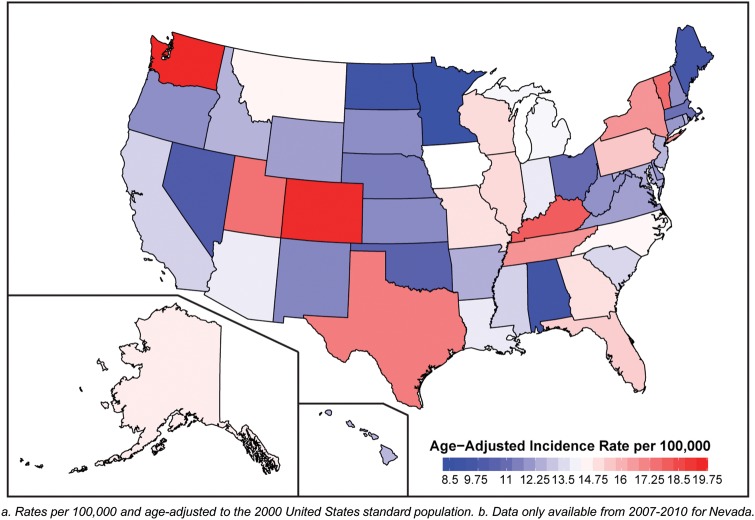
Average Annual Age-Adjusted Incidence Ratesa of Meningioma by Regionb, CBTRUS Statistical Report: NPCR and SEER, 2007–2011c.
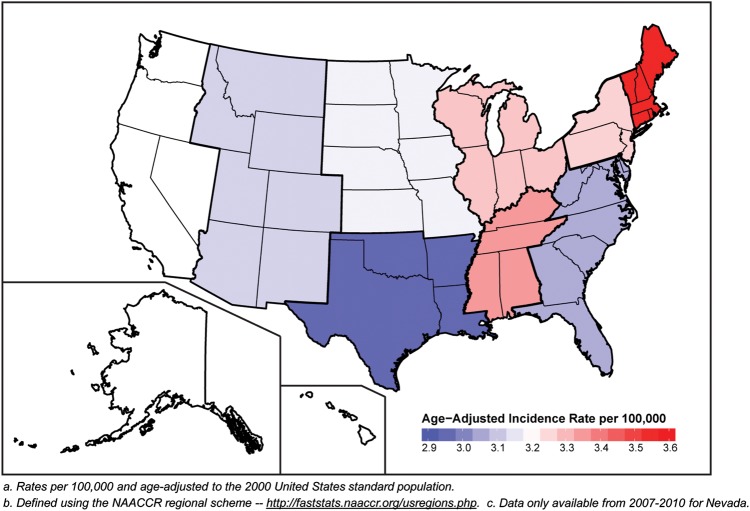
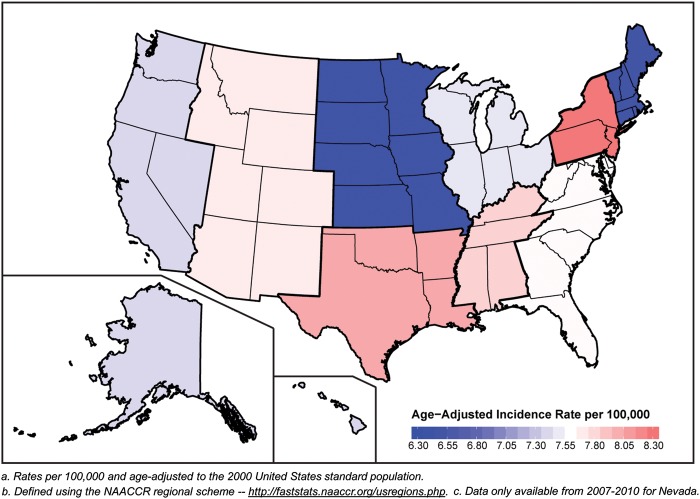
Average Annual Age-Adjusted Incidence Ratesa of Glioblastoma by Regionb, CBTRUS Statistical Report: NPCR and SEER, 2007–2011c.
References
-
- Centers for Disease Control and Prevention (CDC) National Program of Cancer Registries Cancer Surveillance System Rationale and Approach. 1999. http://www.cdc.gov/cancer/npcr/pdf/npcr_css.pdf .
-
- Cancer Registries Amendment Act, 102nd Cong. § 515 (1992) http://www.gpo.gov/fdsys/pkg/STATUTE-106/pdf/STATUTE-106-Pg3372.pdf .
-
- Benign Brain Tumor Cancer Registries Amendment Act, 107th Cong. § 260 (2002) http://www.gpo.gov/fdsys/pkg/PLAW-107publ260/pdf/PLAW-107publ260.pdf .
-
- National Cancer Institute. Overview of the SEER Program http://seer.cancer.gov/about/overview.html .
-
- Louis DN, Ohgaki H, Wiestler OD, Cavanee WK, editors. WHO Classification of Tumours of the Central Nervous System. Lyon, France: International Agency for Research on Cancer; 2007.
MeSH terms
Grants and funding
LinkOut - more resources
Full Text Sources
Other Literature Sources
Medical
