. 2015 Jan;81(1):17-30.
doi: 10.1128/AEM.02246-14. Epub 2014 Oct 10.

Use of adaptive laboratory evolution to discover key mutations enabling rapid growth of Escherichia coli K-12 MG1655 on glucose minimal medium

Affiliations

Use of adaptive laboratory evolution to discover key mutations enabling rapid growth of Escherichia coli K-12 MG1655 on glucose minimal medium

Ryan A LaCroix et al. Appl Environ Microbiol. 2015 Jan.

Abstract

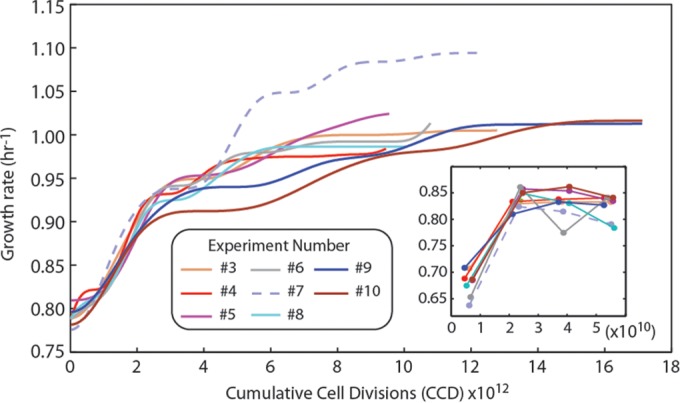
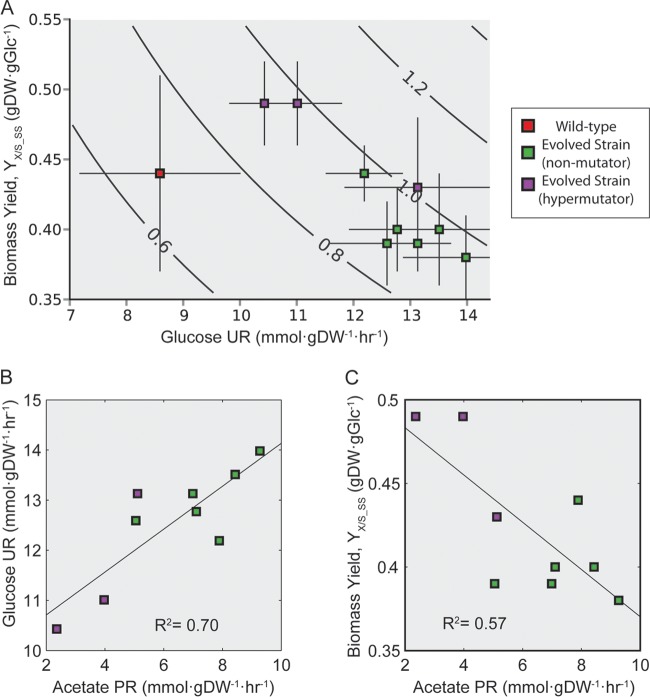
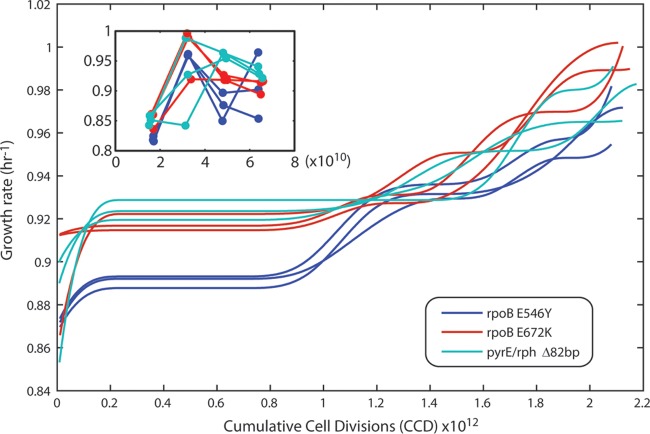
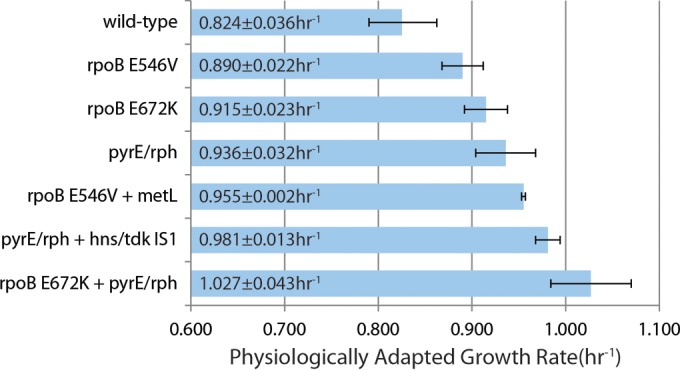
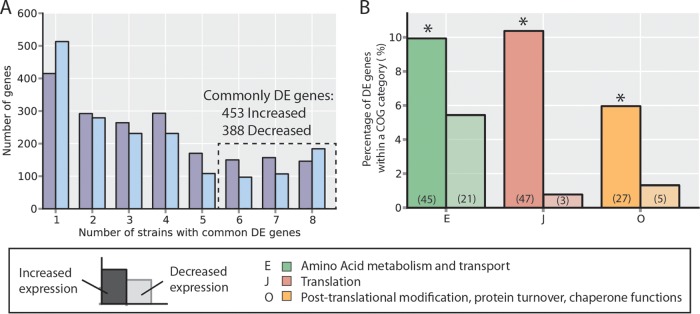
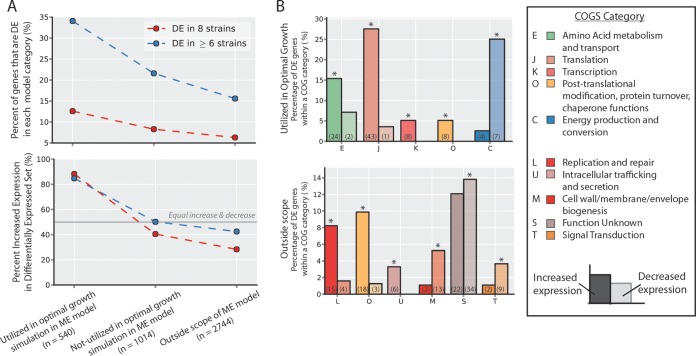
Adaptive laboratory evolution (ALE) has emerged as an effective tool for scientific discovery and addressing biotechnological needs. Much of ALE's utility is derived from reproducibly obtained fitness increases. Identifying causal genetic changes and their combinatorial effects is challenging and time-consuming. Understanding how these genetic changes enable increased fitness can be difficult. A series of approaches that address these challenges was developed and demonstrated using Escherichia coli K-12 MG1655 on glucose minimal media at 37°C. By keeping E. coli in constant substrate excess and exponential growth, fitness increases up to 1.6-fold were obtained compared to the wild type. These increases are comparable to previously reported maximum growth rates in similar conditions but were obtained over a shorter time frame. Across the eight replicate ALE experiments performed, causal mutations were identified using three approaches: identifying mutations in the same gene/region across replicate experiments, sequencing strains before and after computationally determined fitness jumps, and allelic replacement coupled with targeted ALE of reconstructed strains. Three genetic regions were most often mutated: the global transcription gene rpoB, an 82-bp deletion between the metabolic pyrE gene and rph, and an IS element between the DNA structural gene hns and tdk. Model-derived classification of gene expression revealed a number of processes important for increased growth that were missed using a gene classification system alone. The methods described here represent a powerful combination of technologies to increase the speed and efficiency of ALE studies. The identified mutations can be examined as genetic parts for increasing growth rate in a desired strain and for understanding rapid growth phenotypes.


Figures

FIG 1
FIG 1
Fitness trajectories for E. coli populations evolved on glucose minimal medium. Shown is a plot of the fitness (i.e., the growth rate) of the independently evolved experiments versus the number of cumulative cell divisions (CCD). The strain indicated with a dashed line was classified as a hypermutator. The inset shows the growth rates of the initial four flasks of batch growth in each experiment. Overall, the fitness of the hypermutator population outpaced the nonmutators.
FIG 2
FIG 2
Phenotypic properties of evolved strains. Clones isolated from the last flask of the experiments (i.e., endpoint strains of nonmutators) and three hypermutator strains were characterized phenotypically. (A) Plot of the biomass yield versus the glucose uptake rate (UR) (see Materials and Methods for calculations). The isoclines indicate different growth rates. Of all measured phenotypic traits for the evolved strains, the correlations between glucose uptake rate and acetate production rate (PR) (B) and between biomass yield and acetate production rate (C) were the strongest. The percentage of carbon from glucose being secreted in the form of acetate increased in all of the nonmutator endpoint strains (18 to 22%) except for one (13%), compared to the wild type (15%). This percentage decreased for all of the hypermutator strains (8 to 13%).
FIG 3
FIG 3
Fitness trajectories of ALE experiments 3, 4, 7, and 10, along with identified jump regions and resequencing data. Shown are the fitness increases over the course of the evolution as a function of cumulative cell divisions (CCD) and the jump regions (gray boxes) identified using the outlined algorithm. Arrows indicate where colonies were isolated and resequenced. Mutation types are indicated by color: green, mutations that occurred and were found in each subsequent colony resequencing; sienna, mutations that appear in colonies from multiple flasks but not consecutively; and black, mutations that were only found in one particular clone and not in subsequent clones. Further, genetic mutations that replace a previously identified mutation in the same gene are marked with an asterisk. All of the mutations from the hypermutator strain that arose in experiment 7 are not shown (more than 135 total mutations). Plots for all nine experiments are given in Fig. S1 in the supplemental material. Note that genetic expressions in Fig. 3 and in subsequent figures that incorporate a shill (/), such as “pyrE/rph”, refer to intergenic regions, e.g., “pyrE/rph” refers to the pyrE-rph intergenic region.
FIG 4
FIG 4
Fitness trajectory for the validation ALE. Shown is a plot of the validation ALE wherein three unique starting strains were evolved in biological triplicate, each harboring one of the following mutations: rpoB(E546V), rpoB(E672K), and pyrE-rph(Δ82bp). The increase in fitness is shown as a function of the cumulative cell divisions (CCD). The inset shows the unsmoothed and filtered growth rates of the beginning of the experiment to show any possible physiological adaptation that is characteristic of ALE experiments. A smoothing spline will often obscure such abrupt changes.
FIG 5
FIG 5
Causal mutation analysis. Shown is a bar graph of the physiologically adapted growth rates of strains harboring key mutations identified in the present study. The error bars represent 95% confidence intervals from three biological replicates. These results show that the mutation in metL and the IS1 insertion between hns and tdk are causal in the presence of the additional mutations shown. The strain with metL also had one additional mutation, but this was not observed in any other sequenced metL mutant from the ALE experiment. It is clear from the fastest growing mutant, with a growth 1.3-fold greater than the wild type, how significantly the pyrE-rph intergenic region and rpoB gene mutations can affect growth rate. “pyrE/rph” refers only to the 82-bp deletion.
FIG 6
FIG 6
Commonly differentially expressed (DE) genes. (A) Numbers of differentially expressed genes (with respect to the wild-type strain) common across evolved strains. Increased- and decreased-expression genes are counted separately to ensure the direction of change is conserved across strains. The y axis indicates the number of genes differentially expressed in exactly the number of strains indicated on the x axis. From this, 453 increased-expression and 388 decreased-expression genes are identified as common to at least six strains, whereas one would expect no genes in common to all six by random chance (see Fig. S6 in the supplemental material; see also Materials and Methods). (B) The functions of commonly differentially expressed genes for both the increase-expression and decreased-expression sets were interrogated using annotated clusters of orthologous groups (COGs). The groups shown are those which were overrepresented in either the increased or decreased DE gene sets as identified with a hypergeometric test (P < 0.05; *, overrepresented; see Materials and Methods). The percentage of DE genes that fell in each of the overrepresented COG categories is indicated by the bar height, and the total number of DE set genes anotated with that COG function is indicated in parentheses (e.g., 45/453 = 9.9% and 21/388 = 5.4%).
FIG 7
FIG 7
Comparison of genome-scale modeling predictions and categorization of commonly differentially expressed (DE) genes. (A) Commonly differentially expressed genes (n = 841) were compared to a gene classification obtained by using a genome-scale model of E. coli (38). The growth rate was optimized using the model under the same glucose aerobic batch conditions as those used in the ALE experiment. Simulation results were used to classify genes (x axis). Overall, differentially expressed genes are more enriched in the set predicted to enable an optimal growth phenotype (top). Furthermore, within the differentially expressed set of genes, genes predicted to enable an optimal growth phenotype are more often upregulated than downregulated (bottom), and DE genes outside the scope of the model were more often decreased. (B) Using a combination of the increased and decreased DE gene sets and the in silico-predicted gene classification (see Fig. S7 in the supplemental material), subsets of genes could be identified that enabled the observed optimal states of the evolved strains at the functional level. This was accomplished by using COG categories as for Fig. 6B. The percentage of DE genes that fell in each of the overrepresented COG categories in either the increased- or decreased-expression set is indicated by the bar height, and the total number of DE set genes annotated with that COG function is indicated in parentheses.

References

    1. Tenaillon O, Rodriguez-Verdugo A, Gaut RL, McDonald P, Bennett AF, Long AD, Gaut BS. 2012. The molecular diversity of adaptive convergence. Science 335:457–461. doi:10.1126/science.1212986. - DOI - PubMed
    1. Dragosits M, Mozhayskiy V, Quinones-Soto S, Park J, Tagkopoulos I. 2013. Evolutionary potential, cross-stress behavior, and the genetic basis of acquired stress resistance in Escherichia coli. Mol Syst Biol 9:643. doi:10.1038/msb.2012.76. - DOI - PMC - PubMed
    1. Charusanti P, Conrad TM, Knight EM, Venkataraman K, Fong NL, Xie B, Gao Y, Palsson BO. 2010. Genetic basis of growth adaptation of Escherichia coli after deletion of pgi, a major metabolic gene. PLoS Genet 6:e1001186. doi:10.1371/journal.pgen.1001186. - DOI - PMC - PubMed
    1. Palsson B. 2011. Adaptive laboratory evolution. Microbe 6:69–74.
    1. Dragosits M, Mattanovich D. 2013. Adaptive laboratory evolution: principles and applications for biotechnology. Microb Cell Fact 12:64. doi:10.1186/1475-2859-12-64. - DOI - PMC - PubMed

Publication types

Associated data