

Quantitative assessment of prion infectivity in tissues and body fluids by real-time quaking-induced conversion
- PMID: 25304654
- PMCID: PMC4268821
- DOI: 10.1099/vir.0.069906-0
Quantitative assessment of prion infectivity in tissues and body fluids by real-time quaking-induced conversion
Abstract
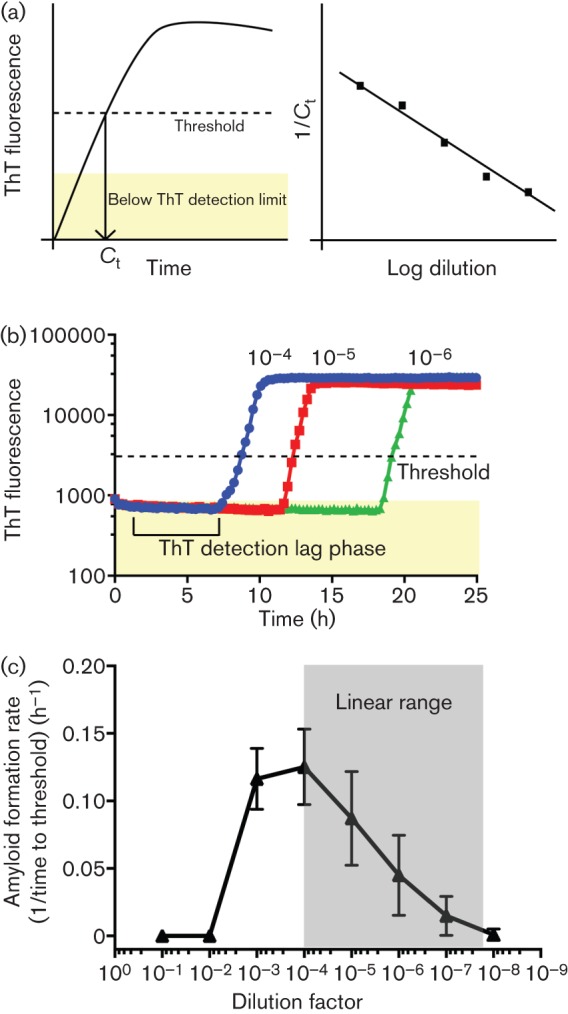
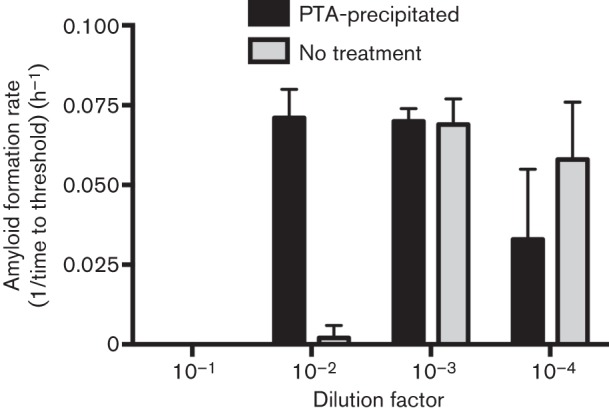
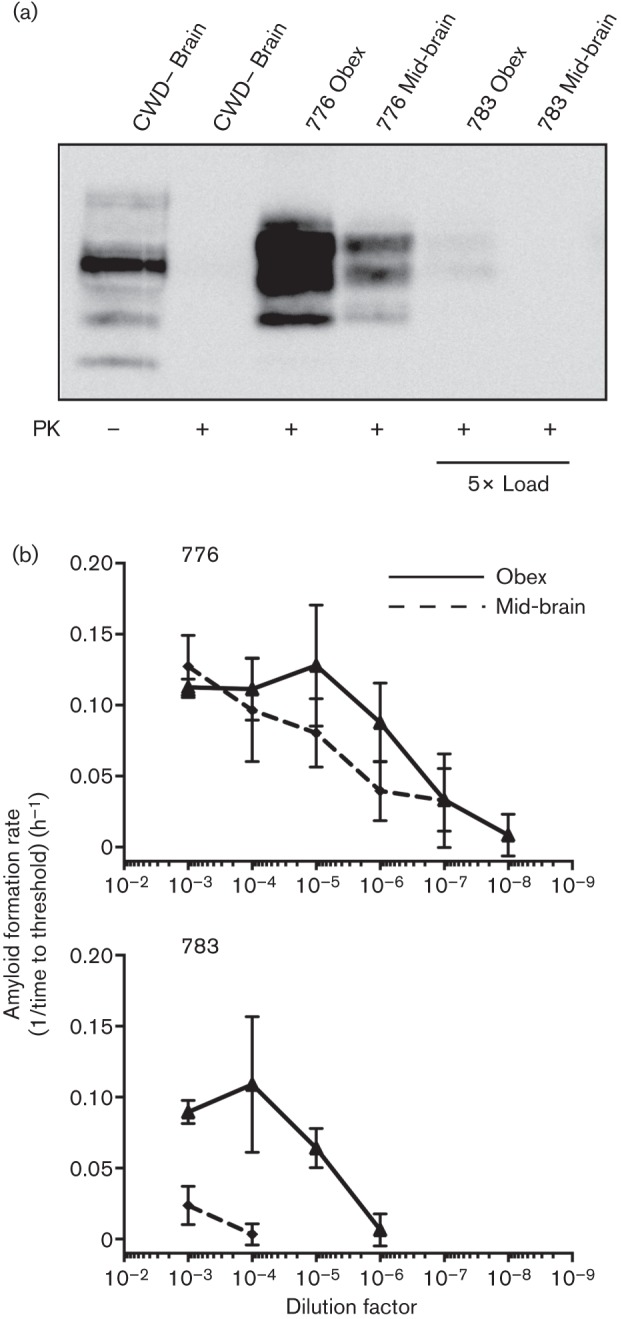
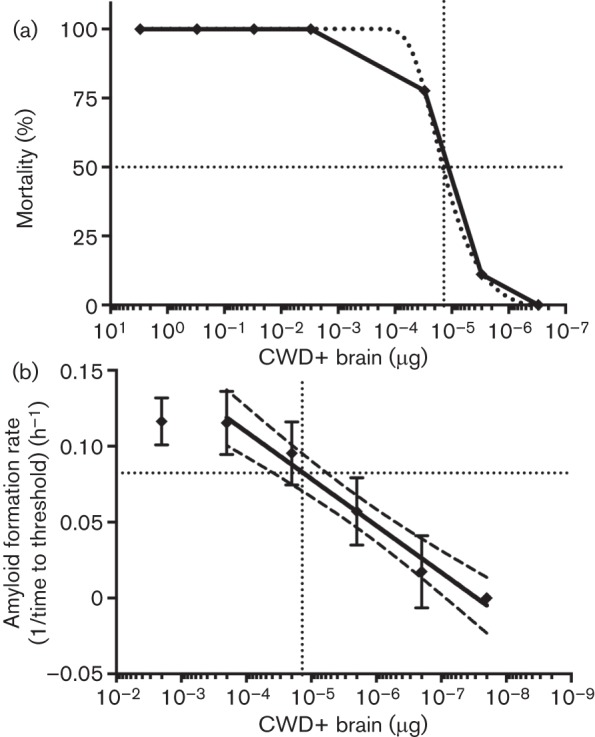
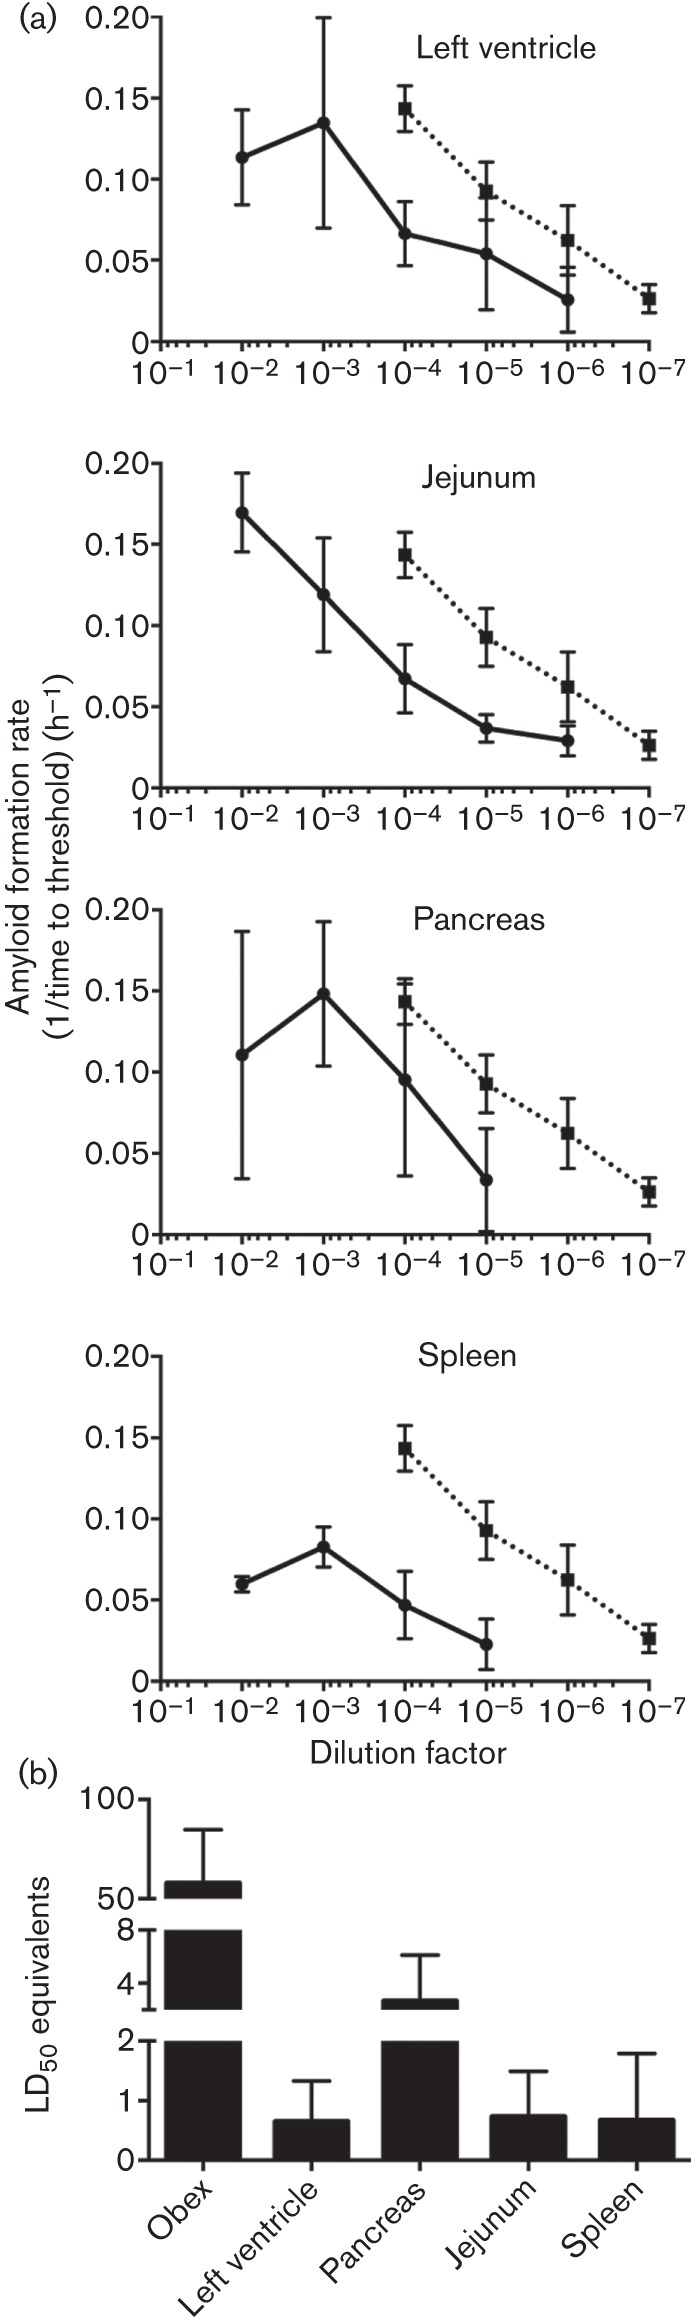
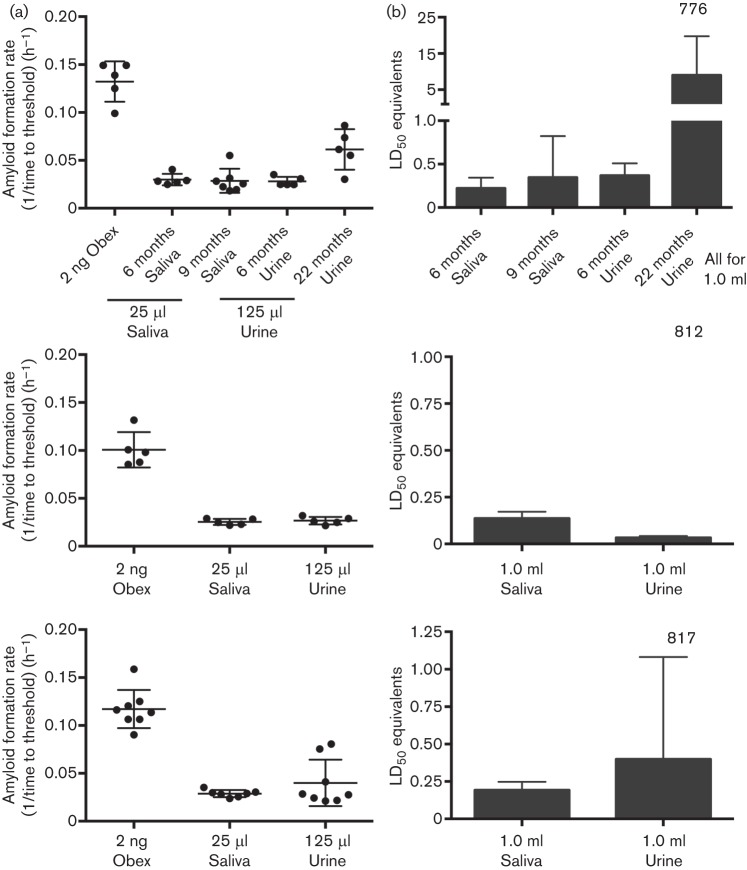
Prions are amyloid-forming proteins that cause transmissible spongiform encephalopathies through a process involving the templated conversion of the normal cellular prion protein (PrP(C)) to a pathogenic misfolded conformation. Templated conversion has been modelled in several in vitro assays, including serial protein misfolding amplification, amyloid seeding and real-time quaking-induced conversion (RT-QuIC). As RT-QuIC measures formation of amyloid fibrils in real-time, it can be used to estimate the rate of seeded conversion. Here, we used samples from deer infected with chronic wasting disease (CWD) in RT-QuIC to show that serial dilution of prion seed was linearly related to the rate of amyloid formation over a range of 10(-3) to 10(-8) µg. We then used an amyloid formation rate standard curve derived from a bioassayed reference sample (CWD+ brain homogenate) to estimate the prion seed concentration and infectivity in tissues, body fluids and excreta. Using these methods, we estimated that urine and saliva from CWD-infected deer both contained 1-5 LD50 per 10 ml. Thus, over the 1-2 year course of an infection, a substantial environmental reservoir of CWD prion contamination accumulates.
Figures
Similar articles
-
Longitudinal Detection of Prion Shedding in Saliva and Urine by Chronic Wasting Disease-Infected Deer by Real-Time Quaking-Induced Conversion.J Virol. 2015 Sep;89(18):9338-47. doi: 10.1128/JVI.01118-15. Epub 2015 Jul 1. J Virol. 2015. PMID: 26136567 Free PMC article.
-
Detection of chronic wasting disease prions in salivary, urinary, and intestinal tissues of deer: potential mechanisms of prion shedding and transmission.J Virol. 2011 Jul;85(13):6309-18. doi: 10.1128/JVI.00425-11. Epub 2011 Apr 27. J Virol. 2011. PMID: 21525361 Free PMC article.
-
Endogenous Brain Lipids Inhibit Prion Amyloid Formation In Vitro.J Virol. 2017 Apr 13;91(9):e02162-16. doi: 10.1128/JVI.02162-16. Print 2017 May 1. J Virol. 2017. PMID: 28202758 Free PMC article.
-
Applications of the real-time quaking-induced conversion assay in diagnosis, prion strain-typing, drug pre-screening and other amyloidopathies.Expert Rev Mol Diagn. 2017 Oct;17(10):897-904. doi: 10.1080/14737159.2017.1368389. Epub 2017 Sep 8. Expert Rev Mol Diagn. 2017. PMID: 28817974 Review.
-
New generation QuIC assays for prion seeding activity.Prion. 2012 Apr-Jun;6(2):147-52. doi: 10.4161/pri.19430. Epub 2012 Apr 1. Prion. 2012. PMID: 22421206 Free PMC article. Review.
Cited by
-
Temporal Characterization of Prion Shedding in Secreta of White-Tailed Deer in Longitudinal Study of Chronic Wasting Disease, United States.Emerg Infect Dis. 2024 Oct;30(10):2118-2127. doi: 10.3201/eid3010.240159. Emerg Infect Dis. 2024. PMID: 39320164 Free PMC article.
-
Inactivation of chronic wasting disease prions using sodium hypochlorite.PLoS One. 2019 Oct 4;14(10):e0223659. doi: 10.1371/journal.pone.0223659. eCollection 2019. PLoS One. 2019. PMID: 31584997 Free PMC article.
-
Standardization of Data Analysis for RT-QuIC-Based Detection of Chronic Wasting Disease.Pathogens. 2023 Feb 13;12(2):309. doi: 10.3390/pathogens12020309. Pathogens. 2023. PMID: 36839581 Free PMC article.
-
Shedding and stability of CWD prion seeding activity in cervid feces.PLoS One. 2020 Mar 3;15(3):e0227094. doi: 10.1371/journal.pone.0227094. eCollection 2020. PLoS One. 2020. PMID: 32126066 Free PMC article.
-
Pathologic and biochemical characterization of PrPSc from elk with PRNP polymorphisms at codon 132 after experimental infection with the chronic wasting disease agent.BMC Vet Res. 2018 Mar 9;14(1):80. doi: 10.1186/s12917-018-1400-9. BMC Vet Res. 2018. PMID: 29523205 Free PMC article.
References
Publication types
MeSH terms
Substances
Grants and funding
LinkOut - more resources
Full Text Sources
Other Literature Sources
Research Materials