

Atherosclerosis exacerbates arrhythmia following myocardial infarction: Role of myocardial inflammation
- PMID: 25304682
- PMCID: PMC4277908
- DOI: 10.1016/j.hrthm.2014.10.007
Atherosclerosis exacerbates arrhythmia following myocardial infarction: Role of myocardial inflammation
Abstract
Background: Atherosclerotic animal models show increased recruitment of inflammatory cells to the heart after myocardial infarction (MI), which impacts ventricular function and remodeling.
Objective: The purpose of this study was to determine whether increased myocardial inflammation after MI also contributes to arrhythmias.
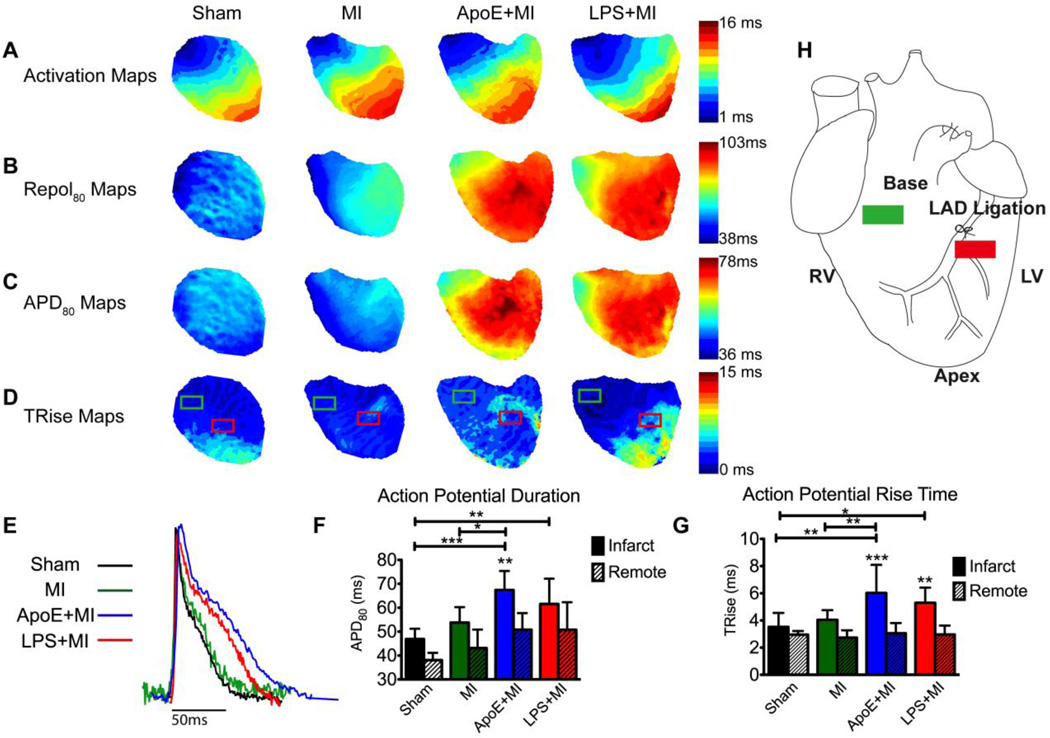
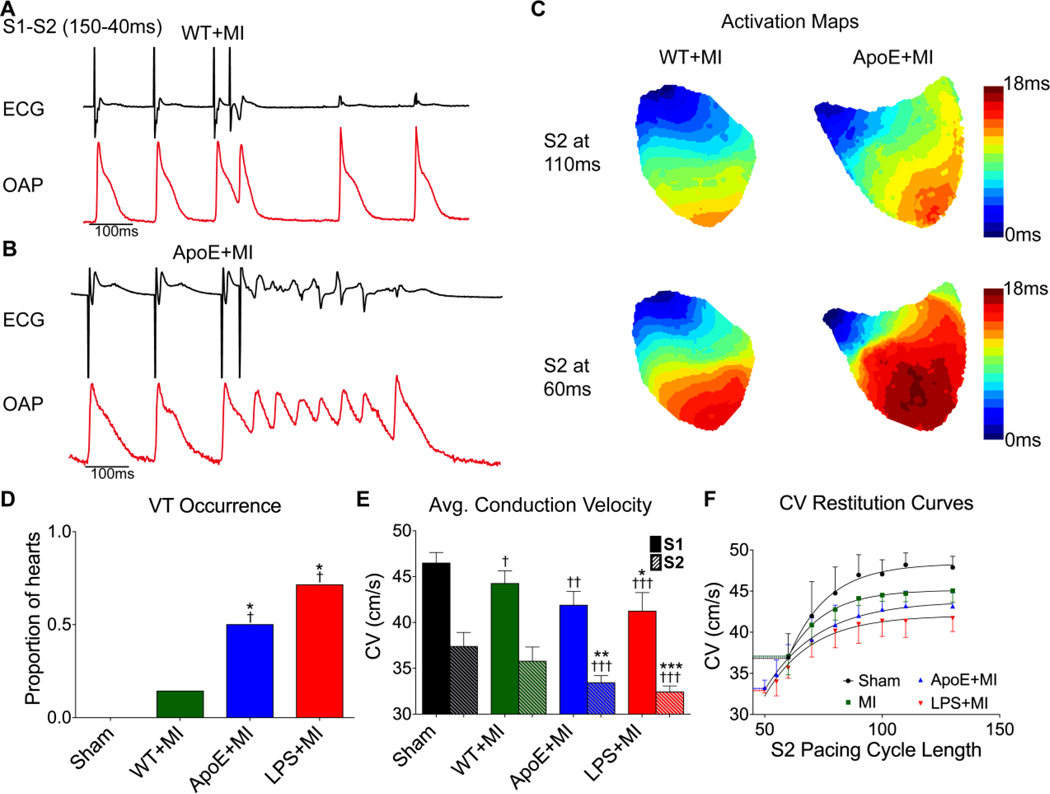
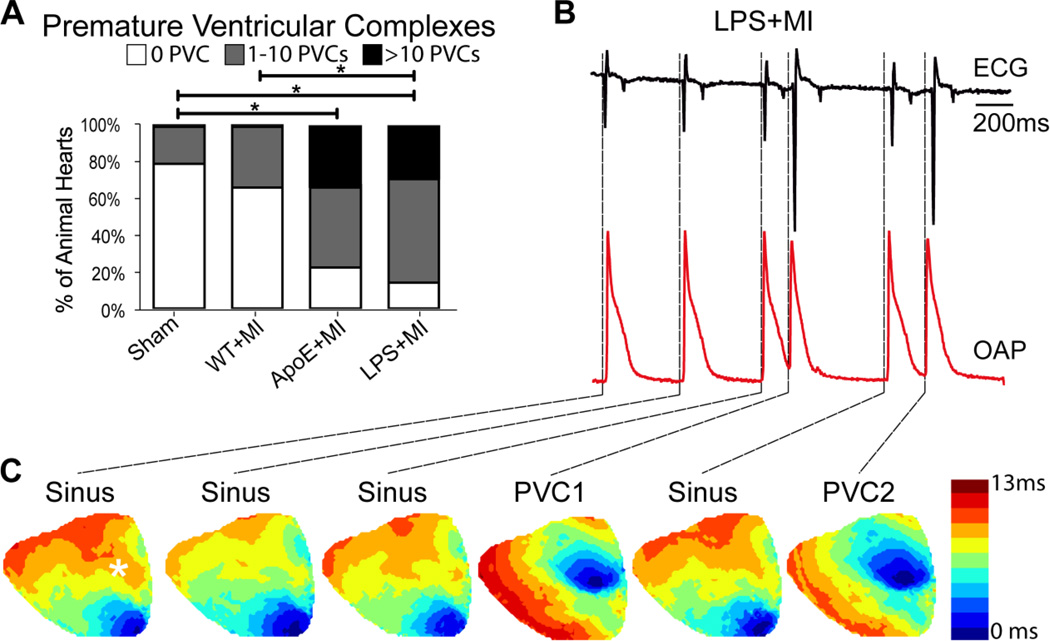
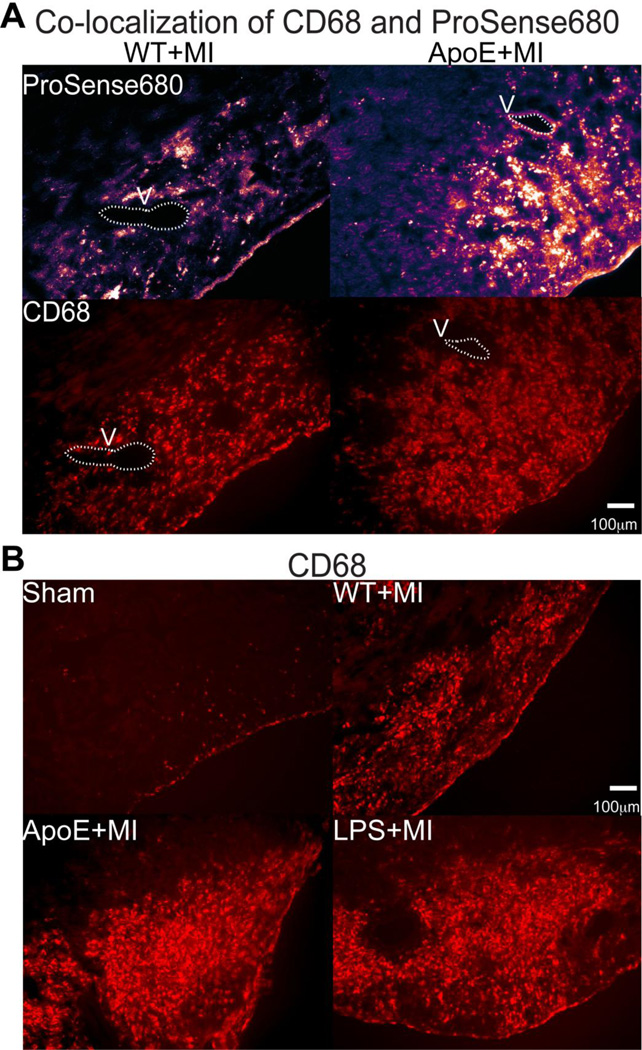
Methods: MI was created in 3 mouse models: (1) atherosclerotic (apolipoprotein E deficient [ApoE(-/-)] on atherogenic diet, n = 12); (2) acute inflammation (wild-type [WT] given daily lipopolysaccharide [LPS] 10 μg/day, n = 7); and (3) WT (n = 14). Sham-operated (n = 4) mice also were studied. Four days post-MI, an inflammatory protease-activatable fluorescent probe (Prosense680) was injected intravenously to quantify myocardial inflammation on day 5. Optical mapping with voltage-sensitive dye was performed on day 5 to assess electrophysiology and arrhythmia susceptibility.
Results: Inflammatory activity (Prosense680 fluorescence) was increased approximately 2-fold in ApoE+MI and LPS+MI hearts vs WT+MI (P<.05) and 3-fold vs sham (P<.05). ApoE+MI and LPS+MI hearts also had prolonged action potential duration, slowed conduction velocity, and increased susceptibility to pacing-induced arrhythmias (56% and 71% vs 13% for WT+MI and 0% for sham, respectively, P<.05, for ApoE+MI and LPS+MI groups vs both WT+MI and sham). Increased macrophage accumulation in ApoE+MI and LPS+MI hearts was confirmed by immunofluorescence. Macrophages were associated with areas of connexin43 (Cx43) degradation, and a 2-fold decrease in Cx43 expression was found in ApoE+MI vs WT+MI hearts (P<.05). ApoE+MI hearts also had a 3-fold increase in interleukin-1β expression, an inflammatory cytokine known to degrade Cx43.
Conclusion: Underlying atherosclerosis exacerbates post-MI electrophysiological remodeling and arrhythmias. LPS+MI hearts fully recapitulate the atherosclerotic phenotype, suggesting myocardial inflammation as a key contributor to post-MI arrhythmia.
Keywords: Arrhythmia; Atherosclerosis; Inflammation; Myocardial infarction; Optical mapping.
Copyright © 2015 Heart Rhythm Society. Published by Elsevier Inc. All rights reserved.
Conflict of interest statement
The authors report no conflicts of interest.
Figures


Comment in
-
Moving beyond the reductionist approach-Time to put the pieces back together in a broken (infarcted) heart.Heart Rhythm. 2015 Jan;12(1):179-80. doi: 10.1016/j.hrthm.2014.10.024. Epub 2014 Oct 31. Heart Rhythm. 2015. PMID: 25446156 No abstract available.
References
-
- Mills WR, Mal N, Forudi F, Popovic ZB, Penn MS, Laurita KR. Optical mapping of late myocardial infarction in rats. Am J Physiol Heart Circ Physiol. 2006;290:306. - PubMed
-
- Nguyen DT, Ding C, Wilson E, Marcus GM, Olgin JE. Pirfenidone mitigates left ventricular fibrosis and dysfunction after myocardial infarction and reduces arrhythmias. Heart Rhythm. 2010;7:1438–1445. - PubMed
-
- Pu J, Robinson RB, Boyden PA. Abnormalities in Ca(i)handling in myocytes that survive in the infarcted heart are not just due to alterations in repolarization. J Mol Cell Cardiol. 2000;32:1509–1523. - PubMed
-
- Yao J-AA, Hussain W, Patel P, Peters NS, Boyden PA, Wit AL. Remodeling of gap junctional channel function in epicardial border zone of healing canine infarcts. Circ Res. 2003;92:437–443. - PubMed
Publication types
MeSH terms
Grants and funding
- N01-HV-00244/HV/NHLBI NIH HHS/United States
- R01HL075360/HL/NHLBI NIH HHS/United States
- R01 HL111600/HL/NHLBI NIH HHS/United States
- P01 HL080101/HL/NHLBI NIH HHS/United States
- HHMI/Howard Hughes Medical Institute/United States
- UL1RR024146/RR/NCRR NIH HHS/United States
- T32GM099608/GM/NIGMS NIH HHS/United States
- R01 HL030077/HL/NHLBI NIH HHS/United States
- P30 HL101280/HL/NHLBI NIH HHS/United States
- HHSN268201000036C/HL/NHLBI NIH HHS/United States
- I01 BX000505/BX/BLRD VA/United States
- R37 HL030077/HL/NHLBI NIH HHS/United States
- R01 HL075360/HL/NHLBI NIH HHS/United States
- P30HL101280/HL/NHLBI NIH HHS/United States
- UL1 RR024146/RR/NCRR NIH HHS/United States
- R01HL111600/HL/NHLBI NIH HHS/United States
- T32 GM099608/GM/NIGMS NIH HHS/United States
- P01HL080101/HL/NHLBI NIH HHS/United States
LinkOut - more resources
Full Text Sources
Other Literature Sources
Medical
Miscellaneous
