. 2014 Nov-Dec;37(9):448-60.
doi: 10.1097/CJI.0000000000000056.

Activation and propagation of tumor-infiltrating lymphocytes on clinical-grade designer artificial antigen-presenting cells for adoptive immunotherapy of melanoma

Affiliations

Activation and propagation of tumor-infiltrating lymphocytes on clinical-grade designer artificial antigen-presenting cells for adoptive immunotherapy of melanoma

Marie-Andrée Forget et al. J Immunother. 2014 Nov-Dec.

Abstract

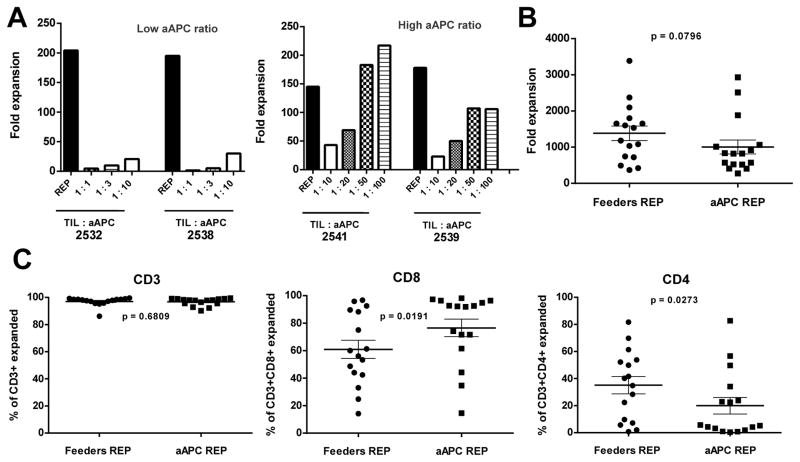
Purpose: Adoptive cell therapy with autologous tumor-infiltrating lymphocytes (TIL) is a therapy for metastatic melanoma with response rates of up to 50%. However, the generation of the TIL transfer product is challenging, requiring pooled allogeneic normal donor peripheral blood mononuclear cells (PBMC) used in vitro as "feeders" to support a rapid-expansion protocol. Here, we optimized a platform to propagate TIL to a clinical scale using K562 cells genetically modified to express costimulatory molecules such as CD86, CD137-ligand, and membrane-bound IL-15 to function as artificial antigen-presenting cells (aAPC) as an alternative to using PBMC feeders.

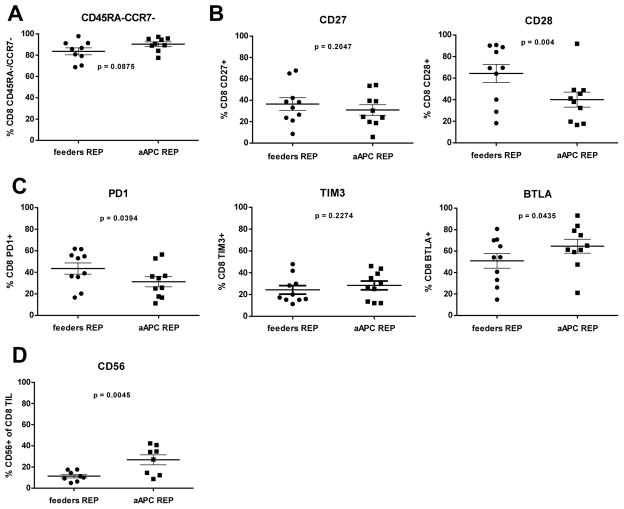
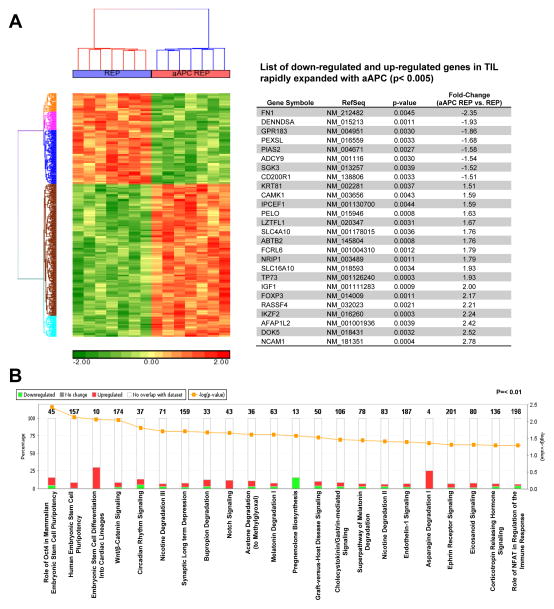
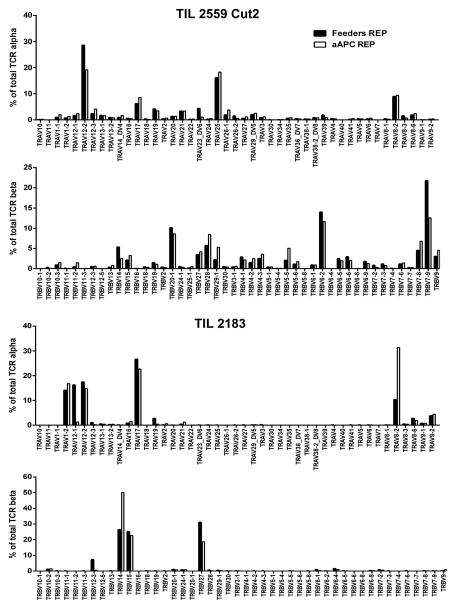
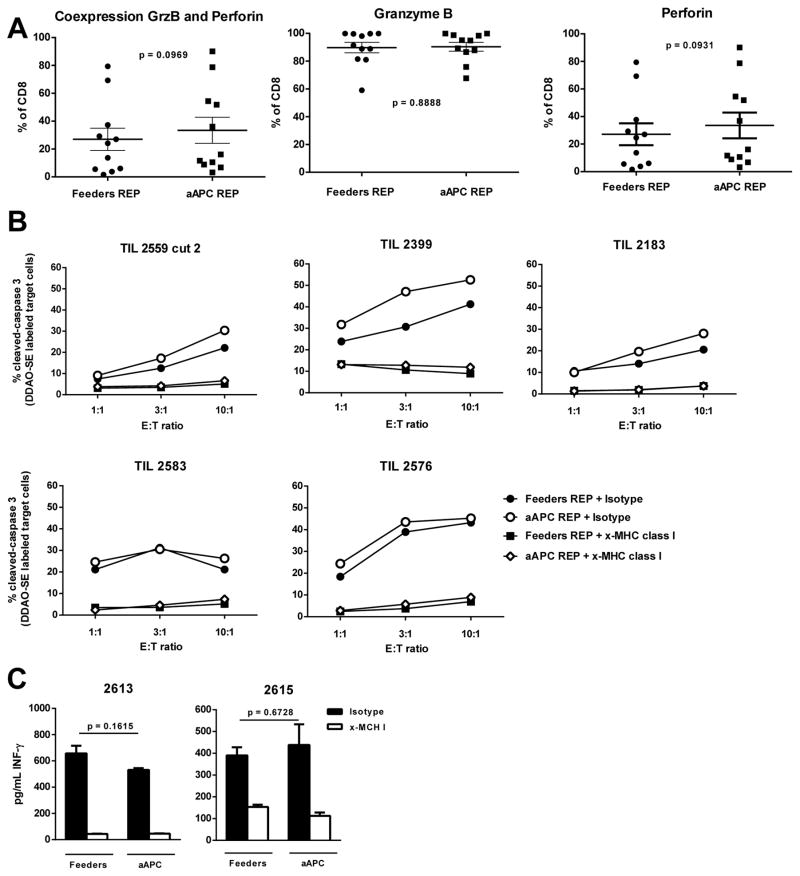
Experimental design: We used aAPC or γ-irradiated PBMC feeders to propagate TIL and measured rates of expansion. The activation and differentiation state was evaluated by flow cytometry and differential gene expression analyses. Clonal diversity was assessed on the basis of the pattern of T-cell receptor usage. T-cell effector function was measured by evaluation of cytotoxic granule content and killing of target cells.

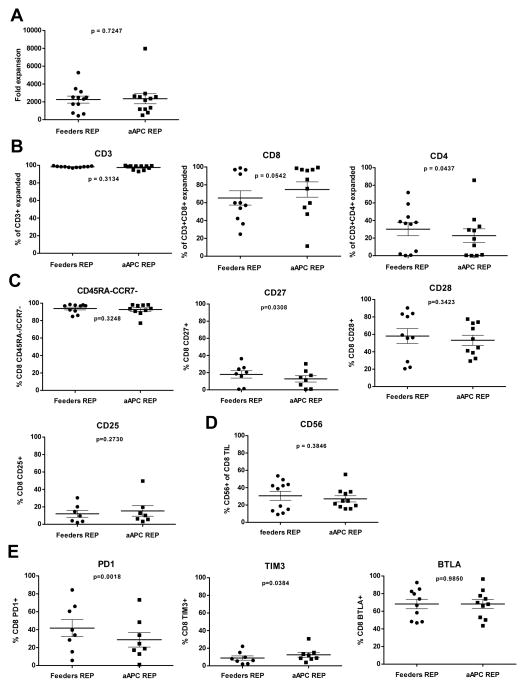
Results: The aAPC propagated TIL at numbers equivalent to that found with PBMC feeders, whereas increasing the frequency of CD8 T-cell expansion with a comparable effector-memory phenotype. mRNA profiling revealed an upregulation of genes in the Wnt and stem-cell pathways with the aAPC. The aAPC platform did not skew clonal diversity, and CD8 T cells showed comparable antitumor function as those expanded with PBMC feeders.

Conclusions: TIL can be rapidly expanded with aAPC to clinical scale generating T cells with similar phenotypic and effector profiles as with PBMC feeders. These data support the clinical application of aAPC to manufacture TIL for the treatment of melanoma.


Figures

Figure 1
Figure 1
Rapid expansion of melanoma TIL using aAPC. A) Melanoma TIL cultured in high doses of IL-2 (6000 IU/mL) for three to five weeks were rapidly expanded using different TIL:aAPC ratios [low (1:1, 1:3, 1:10) and high (1:10, 1:20, 1:50 and 1:100)] and 30 ng/mL of αCD3 mAb (OKT3) with IL-2. Fold expansion of bulk TIL was evaluated on day 7 of the REP. B) Graph showing cumulative data of fold expansion of bulk TIL lines C) Percentage of CD3+ TIL post-REP (left graph) obtained after 14 days of expansion. Middle and right graph show post-REP frequency of respectively CD3+CD8+ and CD3+CD4+ TIL. For each TIL line, REP were setup simultaneously using PBMC-feeders (1:200) and aAPC (1:50) as an expansion platform for direct comparison. Statistics were determined using paired t test and a “p” value <0.05 was considered significant.
Figure 2
Figure 2
Intensive phenotyping by flow cytometry shows similarity in differentiation markers on post-REP CD8+ TIL for both conditions with the exception of CD28, BTLA and CD56. Post-REP TIL were stained with anti-CD3, anti-CD8, anti-CD4, anti-CD16, anti-CD56, anti-CD127, anti-CD28, anti-CD27, anti-CCR7, anti-BTLA, anti-TIM3 and anti-PD1. Results are showed after excluding dead cells by using Aqua®live/dead (AQUA) staining. Graphs show ten TIL lines, with only the most predominant makers presented. (A) Frequency of CCR7 CD45RA in the CD8+ T-cell population after expansion. (B) Analysis of CD27 and CD28 expression in the CD8+ T-cell population. (C) Frequency of PD1 (left), TIM3 (middle) and BTLA (right) positive cells in the CD8 population. (D) Percentage of CD56+ cells expended amongst the post-REP CD8+ TIL. Gating was performed with the use of “fluorescence minus one (FMO)” controls. Statistics were determined using paired t test and a “p” value <0.05 was considered significant.
Figure 3
Figure 3
TIL rapidly expanded using the aAPC platform demonstrated a dual gene signature with attributes of effector and stem cells. (A) Enrichment analysis of a global set of genes from post-REP TIL expanded with feeders or aAPC. The left shows a heat map cluster after removal of the cell line factor. On the right, a table presenting the top 26 genes, ranked by fold-expression changes with a “p” value <0.005, that are showing a differentiation of expression in aAPC post-REP TIL. A Two way ANOVA was performed using two parameters: cell line and expansion method. A comprehensive list of genes ranked by enrichment scores are shown in Supplemental Table 1. (B) Graph showing the percentage (and the number in bold) of gene up regulated (red columns) and down regulated (green columns) in the different canonical pathways. The dark yellow line (log) shows the intensity of change in the gene expression. Analysis was performed using “Ingenuity Pathway Analysis (IPA)”, p <0.01.
Figure 4
Figure 4
aAPC REP does not favor or disfavor expansion of predominant melanoma TIL clonotypes. Measurement of the expression of major TCR α and β chain gene usage found after rapid expansion (REP) with either aAPC REP or PBMC feeders using the NanoString nCounter® technology. This assay directly digitally reads out the level of expression of 45 possible Vα and all known 46 Vβ genes in RNA isolates using bar-coded probes. Two examples representative of six TIL lines from six melanoma patients.
Figure 5
Figure 5
Melanoma CD8+ TIL rapidly expanded with the aAPC platform demonstrated an antitumor potential equivalent than TIL expanded with PBMC-feeders. (A) On day 14 of the REP, cells were harvested, permeabilized and stained for surface CD8, AQUA and intracellular Granzyme B and Perforin. (B) Post-REP TIL were cocultured with DDAO-SE labeled autologous or HLA-A matched tumor cell line for 3 hours. Tumor cells were pre-incubated with 80 μg/mL of blocking antibodies specific for MHC-I (clone W6/32) as a test for class I-dependency of killing or the corresponding isotype (IgG2a). Target-to-Effector (T:E) ratios of 1:1, 1:3 and 1:10 were used. After 3 hours, cells were permeabilized and stained for active caspase-3 by flow cytometry. The graphs indicate percent expression of active caspase-3 in the tumor cells. The MHC-1 blocking control is shown on the bottom row. (C) Post-REP TIL and tumor cells were cocultured with or without MHC-I blocking antibody for 16 hours at a ratio of 1:1. Supernatant was collected and an IFN-γ ELISA assay was performed in triplicates and the mean ± SE is shown for each. Statistics were determined using paired t test and a “p” value <0.05 was considered significant.
Figure 6
Figure 6
Melanoma TIL rapidly expanded with the aAPC in the G-REX flask have a comparable phenotype then when expanded with the PBMC-feeders. Flow cytometry on post-REP CD8+ TIL for both conditions shows similarity in differentiation, activation and inhibition molecules. Post-REP TIL were stained with anti-CD3, anti-CD8, anti-CD4, anti-CD16, anti-CD56, anti-CD127, anti-CD28, anti-CD27, anti-CCR7, anti-CD25, anti-BTLA, anti-TIM3 and anti-PD1. Results are showed after excluding dead cells by using Aqua®live/dead (AQUA) staining. Graphs show ten TIL lines expanded in the G-REX flask. (A) Graph showing cumulative data of fold expansion of bulk TIL lines. (B) Percentage of CD3+ TIL post-REP (left graph) obtained after 14 days of expansion. Middle and right graph show post-REP frequency of respectively CD3+CD8+ and CD3+CD4+ TIL. Frequency of CCR7 CD45RA in the CD8+ T-cell population after expansion (C) Frequency of CCR7 CD45RA (upper left graph), CD27 (middle), CD28 (right) and CD25 (lower left graph) in the CD8+ T-cell population after expansion. Frequency of PD-1, TIM3 and BTLA positive cells in the CD8 population. (D) Percentage of CD56+ cells expended amongst the post-REP CD8+ TIL. (E) Frequency of PD-1 (left), TIM3 (middle) and BTLA (right) positive cells in the CD8 population. Gating was performed with the use of “fluorescence minus one (FMO)” controls. Statistics were determined using paired t test and a “p” value <0.05 was considered significant.

References

    1. Dudley ME, Wunderlich JR, Yang JC, et al. Adoptive cell transfer therapy following non-myeloablative but lymphodepleting chemotherapy for the treatment of patients with refractory metastatic melanoma. Journal of Clinical Oncology. 2005;23:2346–2357. - PMC - PubMed
    1. Besser MJ, Shapira-Frommer R, Treves AJ, et al. Clinical responses in a phase II study using adoptive transfer of short-term cultured tumor infiltration lymphocytes in metastatic melanoma patients. Clin Cancer Res. 2010;16:2646–2655. - PubMed
    1. Radvanyi LG, Bernatchez C, Zhang M, et al. Specific lymphocyte subsets predict response to adoptive cell therapy using expanded autologous tumor-infiltrating lymphocytes in metastatic melanoma patients. Clin Cancer Res. 2012;18:6758–6770. - PMC - PubMed
    1. Rosenberg SA, Yang JC, Sherry RM, et al. Durable complete responses in heavily pretreated patients with metastatic melanoma using T-cell transfer immunotherapy. Clin Cancer Res. 2011;17:4550–4557. - PMC - PubMed
    1. Itzhaki O, Hovav E, Ziporen Y, et al. Establishment and large-scale expansion of minimally cultured “young” tumor infiltrating lymphocytes for adoptive transfer therapy. J Immunother. 2011;34:212–220. - PubMed

Publication types