. 2014 Dec 12;289(50):34709-27.
doi: 10.1074/jbc.M114.608562. Epub 2014 Oct 10.

Aromatic anchor at an invariant hormone-receptor interface: function of insulin residue B24 with application to protein design

Affiliations

Aromatic anchor at an invariant hormone-receptor interface: function of insulin residue B24 with application to protein design

Vijay Pandyarajan et al. J Biol Chem. .

Abstract

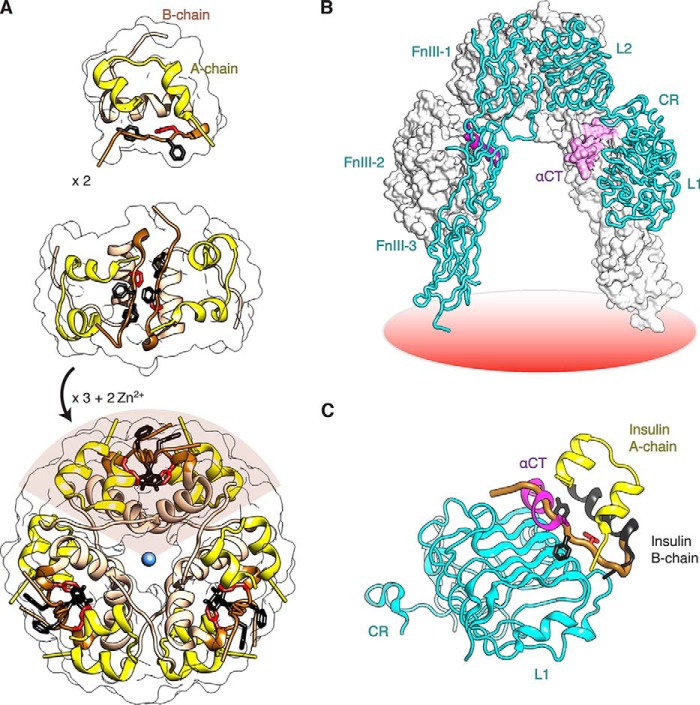
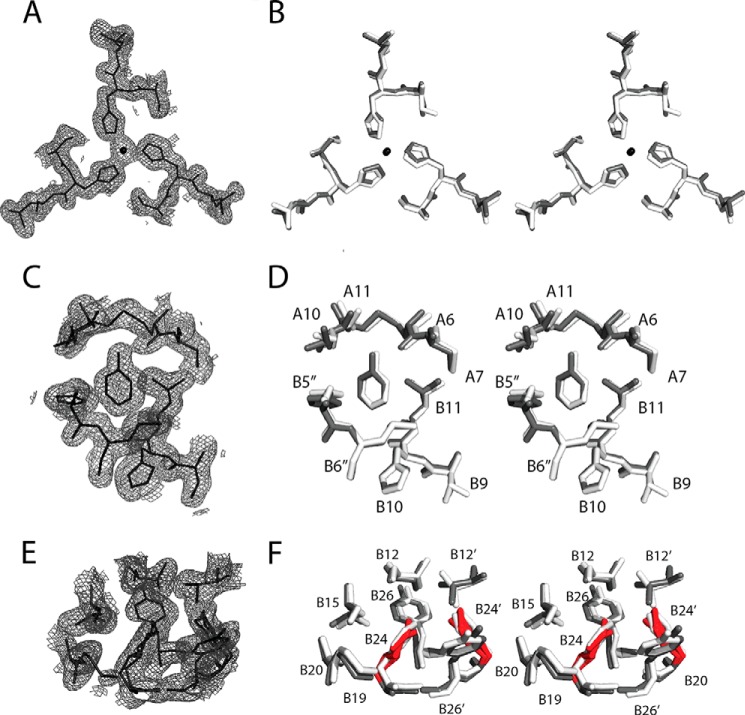
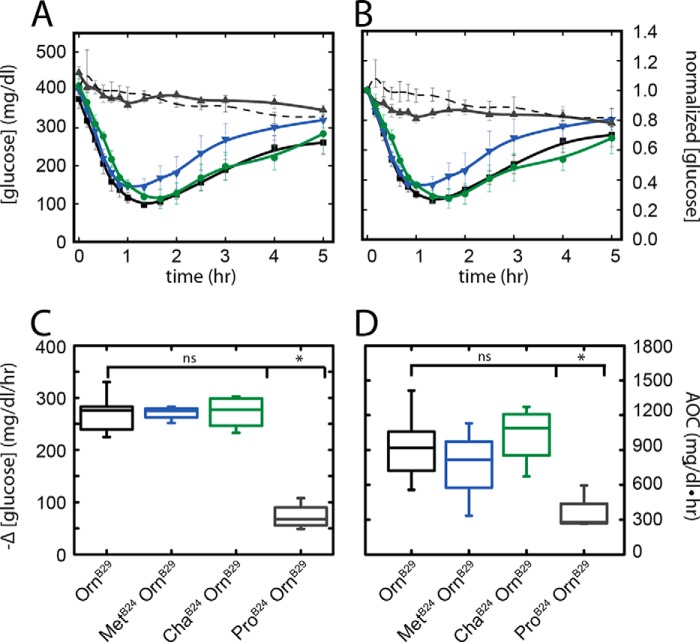
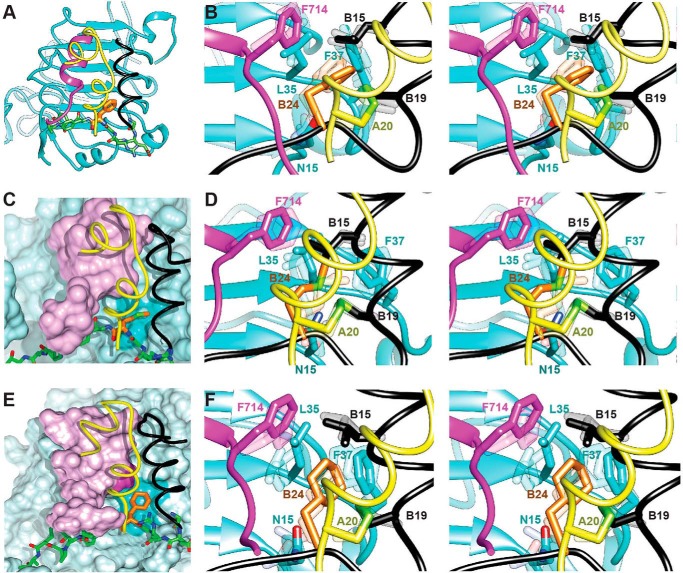
Crystallographic studies of insulin bound to fragments of the insulin receptor have recently defined the topography of the primary hormone-receptor interface. Here, we have investigated the role of Phe(B24), an invariant aromatic anchor at this interface and site of a human mutation causing diabetes mellitus. An extensive set of B24 substitutions has been constructed and tested for effects on receptor binding. Although aromaticity has long been considered a key requirement at this position, Met(B24) was found to confer essentially native affinity and bioactivity. Molecular modeling suggests that this linear side chain can serve as an alternative hydrophobic anchor at the hormone-receptor interface. These findings motivated further substitution of Phe(B24) by cyclohexanylalanine (Cha), which contains a nonplanar aliphatic ring. Contrary to expectations, [Cha(B24)]insulin likewise exhibited high activity. Furthermore, its resistance to fibrillation and the rapid rate of hexamer disassembly, properties of potential therapeutic advantage, were enhanced. The crystal structure of the Cha(B24) analog, determined as an R6 zinc-stabilized hexamer at a resolution of 1.5 Å, closely resembles that of wild-type insulin. The nonplanar aliphatic ring exhibits two chair conformations with partial occupancies, each recapitulating the role of Phe(B24) at the dimer interface. Together, these studies have defined structural requirements of an anchor residue within the B24-binding pocket of the insulin receptor; similar molecular principles are likely to pertain to insulin-related growth factors. Our results highlight in particular the utility of nonaromatic side chains as probes of the B24 pocket and suggest that the nonstandard Cha side chain may have therapeutic utility.

Keywords: Diabetes; Hormone; Mutagenesis; Protein Design; Protein Structure; Receptor Tyrosine Kinase; nonstandard mutagenesis.


Figures

FIGURE 1.
FIGURE 1.
Structure of insulin and receptor ectodomain. A, assembly of zinc insulin hexamer. The monomeric hormone (A and B chains, top panel) forms zinc-free dimers via anti-parallel association of B chain α-helices and C-terminal β-strands (brown, middle panel); two zinc ions then mediate assembly of three dimers to form the classical hexamer (T6, bottom panel). The A chain is shown in yellow (ribbon), and the B chain in light brown (B1–B19) or brown (B20–B30). Conserved aromatic residues PheB25 and TyrB26 are shown as black sticks, and PheB24 is shown in red. The Zn2+ ion is depicted in blue. B, Λ-shaped IR ectodomain homodimer. One protomer is shown as a ribbon (labeled), and the other as a molecular surface. Domains are as follows: L1, first leucine-rich repeat domain; CR, cysteine-rich domain; L2, second leucine-rich repeat domain; FnIII-1–3, respective first, second, and third fibronectin type III domains; and αCT, α-chain C-terminal segment. C, overlay illustrating insulin in its classical free conformation bound to site 1 of the microreceptor (L1-CR + αCT(704–719); designated μIR) (5). L1 and part of CR are shown in cyan, and αCT in magenta. PheB24, PheB25, and TyrB26 are as in A. The B chain is shown in dark gray (B6–B19); the position of the brown tube (residues B20–B30) would lead to a steric clash between B26–B30 and αCT. The figure was in part modified from Menting et al. (6), with permission of the authors. Coordinates were obtained from PDB entries 4INS, 2DTG, and 3W11.
FIGURE 2.
FIGURE 2.
Sequence of insulin and its receptor engagement. A, sequence of insulin and sites of modification. Substitutions were introduced at position PheB24 (red with asterisk). Substitution of LysB29 by ornithine or the pairwise substitution of ProB28 and LysB29 by LysB28 and ProB29 facilitated semi-synthesis; the latter occurs in a prandial insulin analog (Humalog®). B, representation of residues B20–B27 (carbon atoms green, nitrogen atoms blue, and oxygen atoms red) packed between αCT and the L1-β2 sheet in a refined μIR complex (6). B chain residues B8–B19 are shown as a black ribbon and the A chain as a yellow ribbon; residues A1–A3 are concealed behind the surface of αCT. Key contact surfaces of αCT with B24–B26 are highlighted in magenta, and of the L1 domain with B24–B26 are highlighted in cyan; L1 and αCT surfaces that do not interact with B24–B26 are shown in lighter shades. C, orthogonal view to B, showing interaction of the side chain of PheB24 with the nonpolar surface of the L1-β2 sheet. TyrB26 is hidden below the surface of αCT. Engagement of conserved residues A1–A3 against the nonpolar surface of αCT is shown at top. D, environment of PheB24 within site 1 complex (stereo). Coordinates for B–D were obtained from PDB entry 4OGA.
FIGURE 3.
FIGURE 3.
Functional screening of insulin analogs and receptor binding assays. A, competitive binding assay of [OrnB29]insulin to the insulin receptor (black line, orange squares). For reference, predicted binding isotherms are shown corresponding to putative analogs with Kd values that are 10-fold (red), 100-fold (blue), or 1000-fold (green) greater than that of [OrnB29]insulin. Vertical axis, B/B0, where B is [125I-TyrA14]insulin bound by receptor at a given insulin analog concentration, and B0 is the baseline value ([125I-TyrA14]insulin bound in the absence of unlabeled insulin analog). Horizontal axis, log concentration of insulin analog. Filled black circles indicate approximate displacement of labeled [125I-TyrA14]insulin on binding of GluB24 (top), ValB24 (middle), and GlyB24 (bottom), each at a concentration of 0.75 nm. B, classification of insulin analogs based on fraction of remaining γ-counts as follows: high (I), ≤20%; intermediate (II), 21–40%; low (III), 41–70%; very low (IV), 71–100% relative to WT insulin. C, complete [125I-TyrA14]insulin displacement assays of selected B24 analogs as follows: [OrnB29]insulin (red squares); [GlyB24,OrnB29]insulin (blue diamonds); [IleB24,OrnB29]insulin (purple inverted triangles); [LeuB24,OrnB29]insulin (brown triangles); and [MetB24,OrnB29]insulin (green circles). D, corresponding receptor binding assays of ChaB24-substituted analogs in relation to respective controls as follows: [OrnB29]insulin (orange squares); [ChaB24,OrnB29]insulin (maroon x); [ChaB24-KP]insulin (purple stars) versus controls human insulin (black squares); and KP-insulin (green cross).
FIGURE 4.
FIGURE 4.
Biophysical assays of structure and stability. A, CD spectra of [IleB24,OrnB29]insulin (amber), [LeuB24,OrnB29]insulin (purple, overlapping spectra), and [GlyB24,OrnB29]insulin (pink, overlapping spectra) in relation to control spectra of [OrnB29]insulin (black line) and WT insulin (open circles). B, guanidine-unfolding transitions as monitored by ellipticity at 222 nm; color code is as in A. C, CD spectra of [OrnB29]insulin (black line), [MetB24,OrnB29]insulin (blue), and [ChaB24,OrnB29]insulin (green). D, CD-detected guanidine unfolding transitions as monitored by ellipticity at 222 nm; color code is as in C. E, CD spectra of [LysB28,ProB29]insulin (black dot-dash) and [ChaB24,LysB28,ProB29]insulin (red). F, guanidine unfolding transitions as monitored by ellipticity at 222 nm; color code is as in E. Results of two-state modeling of the denaturation studies are given in Fig. 8A (histogram of ΔGu values) and Table 3 (ΔGu, Cmid, and m values). Control data for WT insulin in A and B were adapted from Pandyarajan et al. (62).
FIGURE 5.
FIGURE 5.
1H NMR spectroscopy of DKP-insulin and [ChaB24-DKP]insulin. Two-dimensional spectroscopy of [ChaB24-DKP]insulin (A) and DKP-insulin (B) is shown. At left are TOCSY spectra of aromatic spin systems; at right are NOESY spectra in region containing cross-peaks between aromatic protons (vertical axis, ω2) and aliphatic protons, including upfield shifted methyl groups (horizontal axis, ω1). Brackets/arrows denote aromatic and methyl group resonances with labeled residues.
FIGURE 6.
FIGURE 6.
Crystal structure of [ChaB24,OrnB29]insulin. A, R6 zinc hexamer. The A and B chains are shown in black and green; ChaB24 side chains are highlighted in red. The two axial zinc ions are aligned in the center (blue), coordinated by trimer-related HisB10 side chains (white). B, superposition of a representative analog protomer (gray) and WT protomer (white). The side chains of ChaB24 (red) and PheB24 (white) are shown as sticks. C, stereo view of aromatic residues (gray) and ChaB24 (red) at dimer interface. D, expanded view of the side chains near B24 in the analog structure (gray) and WT structure (white). Sulfur atoms of cysteine A20–B19 are shown as yellow spheres. Coordinates of the WT R6 hexamer were obtained from PDB entry 1ZNJ.
FIGURE 7.
FIGURE 7.
(2FobsFcalc) electron density maps. A, on-axis view of a representative zinc ion-binding site in R6 analog hexamer. B, superposition (stereo view) of zinc-binding sites in the analog hexamer (gray) and WT R6 hexamer (white). Zn2+ ion is shown as a black sphere. Not shown: Zn2+-coordinating Cl anion. C, electron density of a representative bound phenolic ligand. Its para-OH group forms hydrogen bonds with the carbonyl oxygen and amide nitrogen of CysA6 and CysA11, respectively (cysteine A6–A11). The phenolic ring makes van der Waals contacts within the dimer-dimer interface of the hexamer; contacts include HisB5 of another dimer. D, stereo view corresponding to C. E, electron density of ChaB24 and surrounding residues. F, stereo view corresponding to E (stick representation). The two chair conformations of ChaB24 and ChaB24′ at this dimer interface are highlighted in red. Coordinates of the WT R6 hexamer were obtained from PDB entry 1ZNJ.
FIGURE 8.
FIGURE 8.
Biophysical and self-assembly properties of B24 analogs. A, thermodynamic stabilities as inferred from two-state modeling of the guanidine denaturation assays shown in Fig. 4. B, time to fibril formation (lag time) at 37 °C for WT insulin (HI, purple circles), [OrnB29]insulin (black circles), [MetB24,OrnB29]insulin (blue circles), [ChaB24,OrnB29]insulin (green circles), [LysB28,ProB29]insulin (KP, open circles), and [ChaB24,LysB28,ProB29]insulin (ChaB24-KP, red circles). Circles indicate individual measurements. Onset of fibrillation was defined as a 2-fold enhancement of thioflavin T fluorescence. C and D, optical absorption spectra of Co2+-stabilized R6 insulin hexamers and kinetics of metal ion release. C, Co2+ d-d absorption bands of WT insulin (pink line), [OrnB29]insulin (black line), [ChaB24,OrnB29]insulin (green line), and [MetB24,OrnB29]insulin (blue line) near 550 nm provide a signature of the R state. The amplitudes of the [ChaB24,OrnB29]insulin and [MetB24,OrnB29]insulin are attenuated by 7 ± 1 and 37 ± 2% relative to [OrnB29]insulin. D, kinetic analysis based on Co2+ sequestration by EDTA. The color code is as in C. E, corresponding absorption spectra of Co2+-stabilized R6 insulin hexamers as follows: WT insulin (pink line); KP-insulin (black dot-dashed line); and [ChaB24-KP]insulin (red line). The amplitude of [ChaB24-KP]insulin is attenuated by 22% (±1) relative to KP-insulin. F, kinetic analysis based on Co2+ sequestration by EDTA. WT data were adapted from Ref. . The color code is as in E. Half-lives derived from the data in D and F are given in Table 5.
FIGURE 9.
FIGURE 9.
Rat IV potency assay. A, time-dependent decrease and recovery of the blood glucose concentration (vertical axis) on i.v. bolus injection of insulin analogs as follows: [OrnB29]insulin (black, n = 8); [ChaB24,OrnB29]insulin (green, n = 4); [MetB24,OrnB29]insulin (blue, n = 4); [ProB24,OrnB29]insulin (gray, n = 4); or diluent (black dashed thin line, n = 3). Measurements were obtained at indicated times (horizontal axis) with vertical bars representing standard errors. B, data in A normalized to initial blood glucose concentrations; vertical scale provides fraction of initial value. C, initial rates of decrease in blood glucose concentration (defined over the 1st h). Box plots represent upper and lower quartiles; the central horizontal bar delineates the median, and the vertical bars represent minimum and maximum values. Although any differences among [OrnB29]insulin (black), [ChaB24,OrnB29]insulin (olive), and [MetB24,OrnB29]insulin (blue) were not significant (ns), each of these analogs was significantly more active than [ProB24,OrnB29]insulin (gray box and asterisk; p < 0.05). D, potencies of insulin analogs as measured by the integrated areas above the curves in A relative to a horizontal line at the starting blood glucose concentration. Of the analogs, only [ProB24,OrnB29]insulin exhibited a significant loss of potency (p < 0.05).
FIGURE 10.
FIGURE 10.
Models of variant hormone-μIR complexes. A, crystal structure of WT insulin complexed with the μIR. B, stereo view of the B24 binding pocket of the structure presented in A following MD simulation and energy minimization. Depicted in transparent shades are two intermediate and representative sets of side-chain orientations arising during the course of the MD simulation. This panel is included as a control for D and F. C and D, molecular models of [MetB24]insulin. C, representative position of MetB24 (orange carbon atom and light green sulfur atom) in the B24-related pocket. Molecular surfaces of L1 (blue) and αCT (lilac) are shown with respect to the insulin A chain (yellow ribbon) and B chain (residues B8–B19 in black and B20–B27 as green sticks). The darker blue patch on the L1 surface indicates key contact residues. D, corresponding stereo view with color code as in B. The side chains of MetB24 are shown with orange carbon atoms and light green sulfur atoms. E and F, molecular models of [ChaB24]insulin. E, representative position of ChaB24 (orange) in the B24-related pocket. The color code is as in C. F, corresponding stereo view of variant μIR complexes containing [ChaB24]insulin with color code as in E. Shown in D and F (transparent shades) are representative side-chain orientations arising in the respective MD simulations as depicted in B for WT insulin.
FIGURE 11.
FIGURE 11.
Sequence and structural comparison of L1 domains in IR and IGF-1R. A, alignment of representative sequences of the insulin receptor and IGF-1R showing the conservation of L1 residues involved in interaction with PheB24, PheB25, and TyrB26 in the μIR complex with the exception of His32 (Phe or Tyr at corresponding position 28 in the L1 domain of IGF-1R) or Phe39 (Ser35 in IGF-1R) (6). The B24 binding pocket contains residues Asn15, Leu37, Phe39, and Phe714; the B25-binding surface contains residue Arg14, whereas the B26-binding surface contains residues Asp12, Arg14, and Val715. For brevity, residues N- and C-terminal to the aligned sequences have been omitted; the numbering refers to the top sequence. B, overlay of the structure of the insulin-complexed μIR (PDB entry 4OGA) with that the L1 domain of IGF-1R (PDB entry 1IGR). The domains of the μIR are (L1) as follows: cyan (insulin A chain); yellow (insulin B chain); black, and (αCT) magenta; the L1 domain of IGF-1R is shown in brown.

References

    1. De Meyts P., Whittaker J. (2002) Structural biology of insulin and IGF1 receptors: implications for drug design. Nat. Rev. Drug Discov. 1, 769–783 - PubMed
    1. Baker E. N., Blundell T. L., Cutfield J. F., Cutfield S. M., Dodson E. J., Dodson G. G., Hodgkin D. M., Hubbard R. E., Isaacs N. W., Reynolds C. D. (1988) The structure of 2Zn pig insulin crystals at 1.5 Å resolution. Philos. Trans. R. Soc. Lond. B Biol. Sci. 319, 369–456 - PubMed
    1. McKern N. M., Lawrence M. C., Streltsov V. A., Lou M. Z., Adams T. E., Lovrecz G. O., Elleman T. C., Richards K. M., Bentley J. D., Pilling P. A., Hoyne P. A., Cartledge K. A., Pham T. M., Lewis J. L., Sankovich S. E., Stoichevska V., Da Silva E., Robinson C. P., Frenkel M. J., Sparrow L. G., Fernley R. T., Epa V. C., Ward C. W. (2006) Structure of the insulin receptor ectodomain reveals a folded-over conformation. Nature 443, 218–221 - PubMed
    1. Smith B. J., Huang K., Kong G., Chan S. J., Nakagawa S., Menting J. G., Hu S.-Q., Whittaker J., Steiner D. F., Katsoyannis P. G., Ward C. W., Weiss M. A., Lawrence M. C. (2010) Structural resolution of a tandem hormone-binding element in the insulin receptor and its implications for design of peptide agonists. Proc. Natl. Acad. Sci. U.S.A. 107, 6771–6776 - PMC - PubMed
    1. Menting J. G., Whittaker J., Margetts M. B., Whittaker L. J., Kong G. K., Smith B. J., Watson C. J., Záková L., Kletvíková E., Jirácek J., Chan S. J., Steiner D. F., Dodson G. G., Brzozowski A. M., Weiss M. A., Ward C. W., Lawrence M. C. (2013) How insulin engages its primary binding site on the insulin receptor. Nature 493, 241–245 - PMC - PubMed

MeSH terms