Comparative Study
. 2014 Oct 12;15(1):889.
doi: 10.1186/1471-2164-15-889.

Impact of whole-genome amplification on the reliability of pre-transfer cattle embryo breeding value estimates

Affiliations
Comparative Study

Impact of whole-genome amplification on the reliability of pre-transfer cattle embryo breeding value estimates

Habib A Shojaei Saadi et al. BMC Genomics. .

Abstract

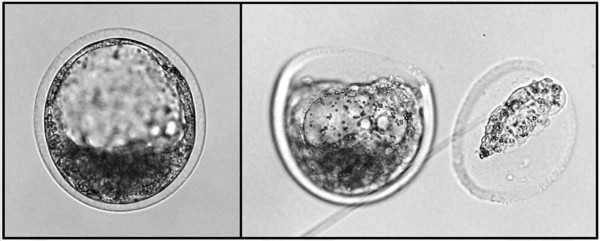
Background: Genome-wide profiling of single-nucleotide polymorphisms is receiving increasing attention as a method of pre-implantation genetic diagnosis in humans and of commercial genotyping of pre-transfer embryos in cattle. However, the very small quantity of genomic DNA in biopsy material from early embryos poses daunting technical challenges. A reliable whole-genome amplification (WGA) procedure would greatly facilitate the procedure.

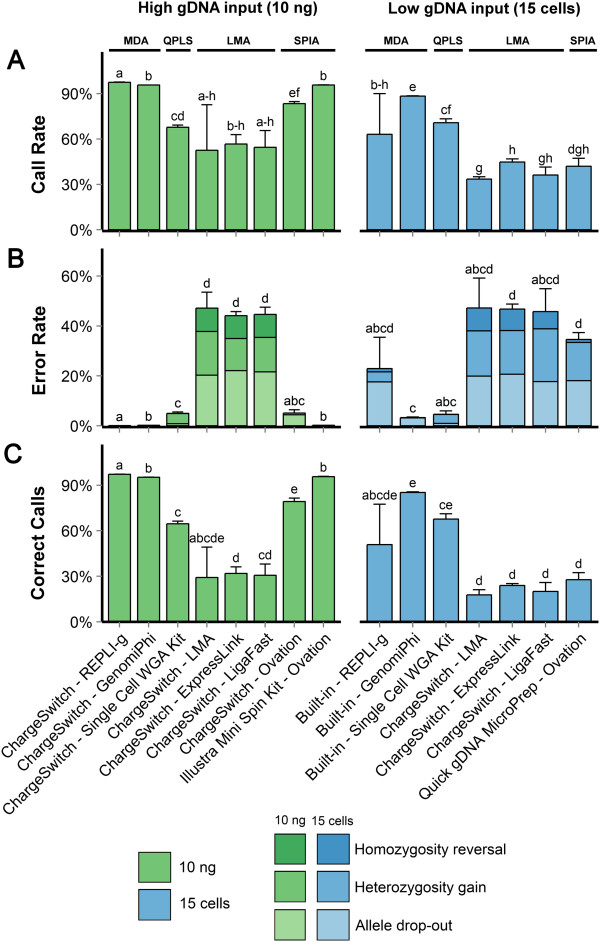
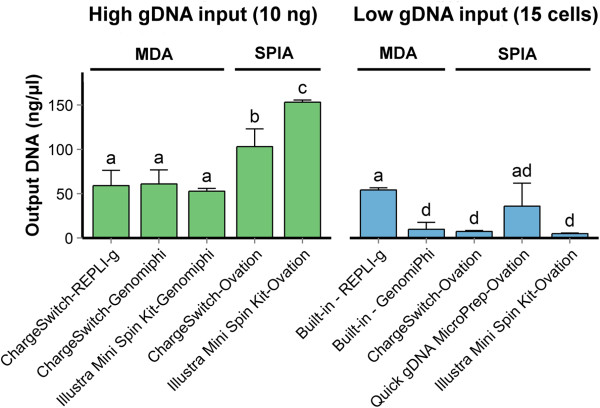
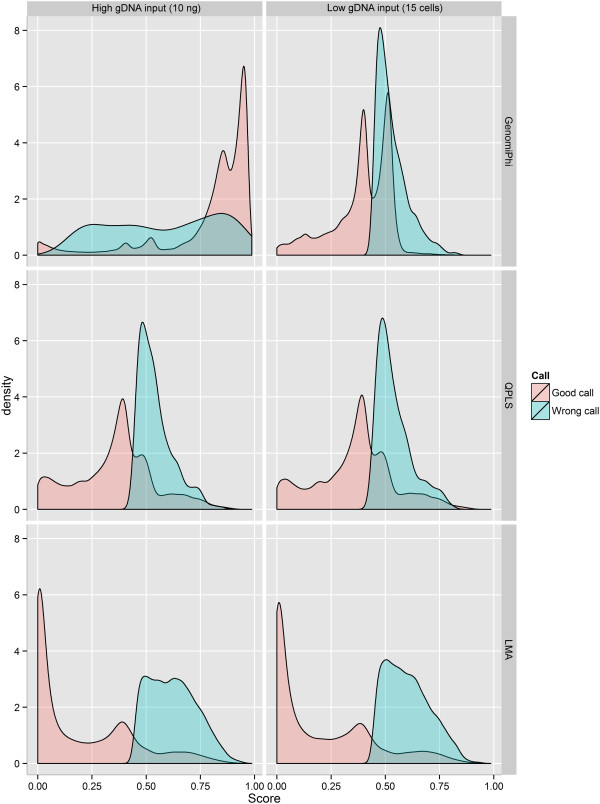
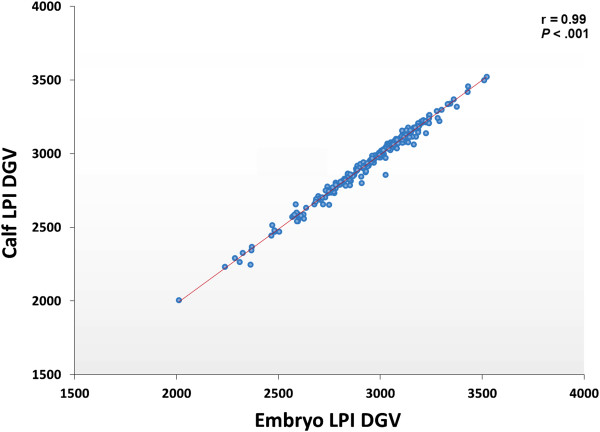
Results: Several PCR-based and non-PCR based WGA technologies, namely multiple displacement amplification, quasi-random primed library synthesis followed by PCR, ligation-mediated PCR, and single-primer isothermal amplification were tested in combination with different DNA extractions protocols for various quantities of genomic DNA inputs. The efficiency of each method was evaluated by comparing the genotypes obtained from 15 cultured cells (representative of an embryonic biopsy) to unamplified reference gDNA. The gDNA input, gDNA extraction method and amplification technology were all found to be critical for successful genome-wide genotyping. The selected WGA platform was then tested on embryo biopsies (n = 226), comparing their results to that of biopsies collected after birth. Although WGA inevitably leads to a random loss of information and to the introduction of erroneous genotypes, following genomic imputation the resulting genetic index of both sources of DNA were highly correlated (r = 0.99, P<0.001).

Conclusion: It is possible to generate high-quality DNA in sufficient quantities for successful genome-wide genotyping starting from an early embryo biopsy. However, imputation from parental and population genotypes is a requirement for completing and correcting genotypic data. Judicious selection of the WGA platform, careful handling of the samples and genomic imputation together, make it possible to perform extremely reliable genomic evaluations for pre-transfer embryos.


Figures

Figure 1
Figure 1
Fragment size of genomic DNA extracted from different gDNA extraction kits. M: DNA molecular size marker. Lane 1: ChargeSwitch gDNA Micro Tissue kit; Lane 2: Quick gDNA MicroPrep kit. The cropped image is not representative of genomic DNA yield, since end volumes differed.
Figure 2
Figure 2
Performance metrics for all tested WGA methods. A) Call rate, the proportion of loci where a call was provided, correct or not. B) Error rate, split into the three possible categories of errors: allele drop-out (AB- > AA), heterozygosity gain (AA- > AB) and homozygous reversal (AA- > BB). The error rate is calculated relative to the number of calls provided by the method. Here error bars represent the standard deviation of the overall error rate, and not of individual types of errors. C) Proportion of correct calls, or loci where the method provided the correct genotype. A “no call” where the reference provided a genotype is considered a failure to provide the correct call. Error bars represent one standard deviation. Bars with different letters represent data that are significantly different (p<0.05), as determined by Post-hoc analyses using Games-Howell test. LMA: Ligation-Mediated Amplification; MDA: Multiple Displacement Amplification; QPLS: Quasi-random Primed Library Synthesis followed by PCR amplification; SPIA: Single Primer Isothermal Amplification.
Figure 3
Figure 3
Yield of amplified gDNA using different combinations of commercial gDNA extraction kits and WGA technologies. When starting with the recommended minimal input (i.e. 10 ng), all kits performed well, however SPIA-based WGA systems produced the most high quantity outputs than the MDA-based WGA systems. Whereas with gDNA obtained from 15 cells, only the REPLI-g Mini kit (MDA-based WGA) and Quick gDNA MicroPrep-Ovation WGA System (SPIA-based WGA) offered the best amplified gDNA output. Error bars represent one standard deviation. Bars with different letters represent data that are significantly different (p<0.05), as determined by Post-hoc analyses using Games-Howell test. MDA: multiple displacement amplification; SPIA: single-primer isothermal amplification.
Figure 4
Figure 4
Correlation between the genotyping call rate and error rate. Dotted lines join replicates from the same method together. A significant high negative correlation (r = −0.88, P<0.001) exists between the genotyping call rate and error rate of the examined WGA technologies, indicating that higher call rates also lead to smaller error rates. Pearson’s product moment correlation coefficient calculated to determine the relationship between the genotyping call rate and error rate. LMA: Ligation-Mediated Amplification; MDA: Multiple Displacement Amplification; QPLS: Quasi-random Primed Library Synthesis followed by PCR amplification; SPIA: Single Primer Isothermal Amplification.
Figure 5
Figure 5
Density plot quality scores for erroneous and correct genotypes. The MDA row represents the results obtained from the Illustra GenomiPhi V2 DNA amplification kit (MDA-based WGA). LMA: Ligation-Mediated Amplification; MDA: Multiple Displacement Amplification; QPLS: Quasi-random Primed Library Synthesis followed by PCR amplification; SPIA: Single Primer Isothermal Amplification.
Figure 6
Figure 6
Embryonic biopsy specimen obtained from trophoblast cells of Day 7.5 bovine embryos. The removed trophoblast cells provide the gDNA that was subjected to the selected WGA procedure. Following analysis, the genotypic information in conjunction with the genomic imputation were used to estimate bovine genomic breeding value.
Figure 7
Figure 7
The correlation of genetic values between the bovine embryo and the corresponding post-natal calf. The scatter chart showing the divergence between the estimated breeding values based on gDNA obtained from embryonic biopsy (trophoblast, D7.5) and based on the gDNA obtained from corresponding calf tail hair follicles after birth (n = 226). The Pearson correlation coefficient calculated to determine the relationship between the genetic values between the bovine early embryo and the corresponding post-natal calf. DGV: Direct Genomic Values; LPI: Life Profit Index.

References

    1. Geraedts JPM, De Wert G. Preimplantation genetic diagnosis. Clin Genet. 2009;76(4):315–325. doi: 10.1111/j.1399-0004.2009.01273.x. - DOI - PubMed
    1. Sermon K, Van Steirteghem A, Liebaers I. Preimplantation genetic diagnosis. Lancet. 2004;363(9421):1633–1641. doi: 10.1016/S0140-6736(04)16209-0. - DOI - PubMed
    1. De Rycke M. Singling out genetic disorders and disease. Genome Med. 2010;2(10):74. doi: 10.1186/gm195. - DOI - PMC - PubMed
    1. Basille C, Frydman R, Aly AE, Hesters L, Fanchin R, Tachdjian G, Steffann J, LeLorc’h M, Achour-Frydman N. Preimplantation genetic diagnosis: State of the art. Eur J Obstet Gynecol Reprod Biol. 2009;145(1):9–13. doi: 10.1016/j.ejogrb.2009.04.004. - DOI - PubMed
    1. Verlinsky Y, Ginsberg N, Lifchez A, Valle J, Moise J, Strom CM. Analysis of the first polar body: preconception genetic diagnosis. Hum Reprod. 1990;5(7):826–829. - PubMed

Publication types

LinkOut - more resources