. 2014 Nov;32(11):1151-1157.
doi: 10.1038/nbt.3048. Epub 2014 Oct 12.

Differentiation of human pluripotent stem cells to cells similar to cord-blood endothelial colony-forming cells

Affiliations

Differentiation of human pluripotent stem cells to cells similar to cord-blood endothelial colony-forming cells

Nutan Prasain et al. Nat Biotechnol. 2014 Nov.

Abstract

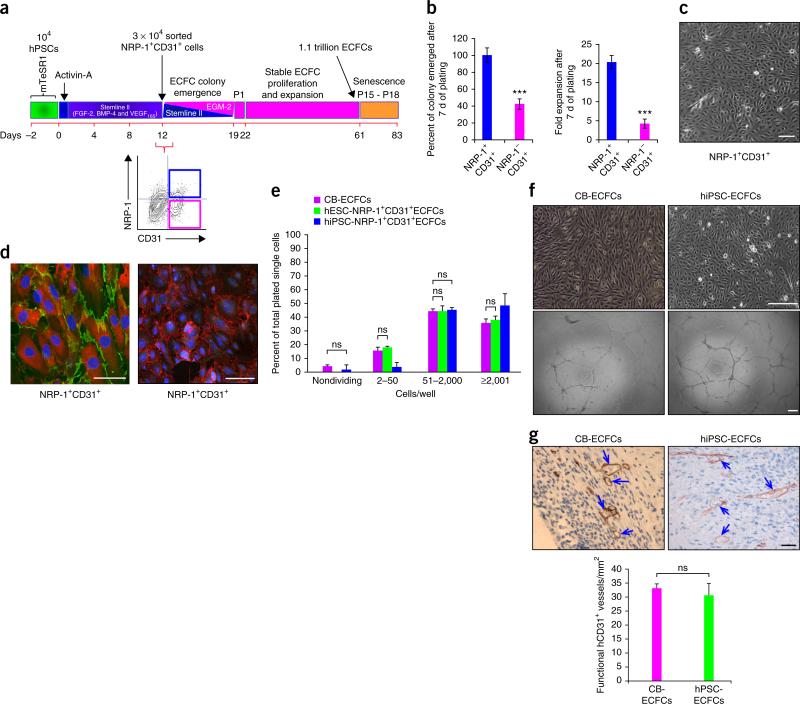
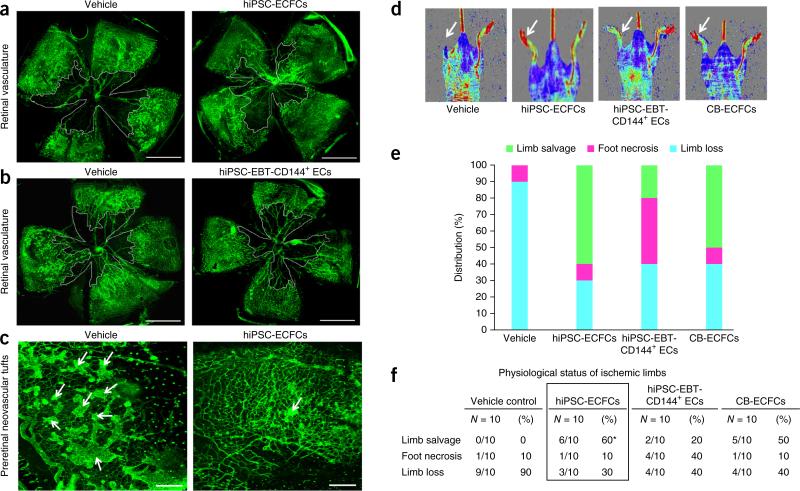
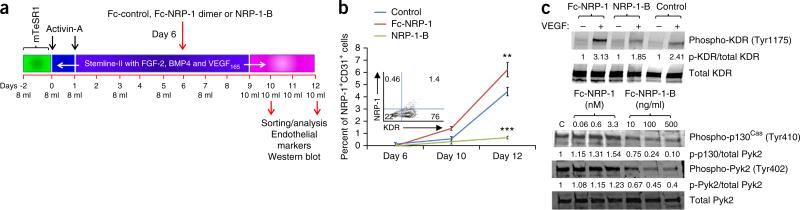
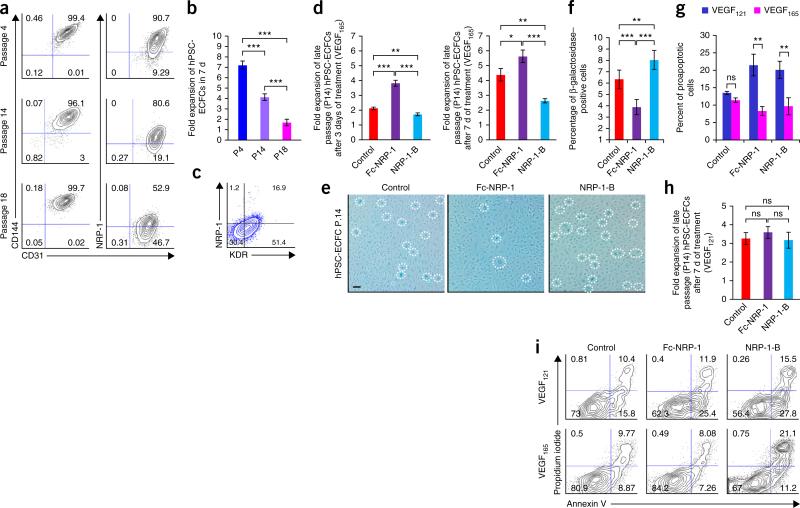
The ability to differentiate human pluripotent stem cells into endothelial cells with properties of cord-blood endothelial colony-forming cells (CB-ECFCs) may enable the derivation of clinically relevant numbers of highly proliferative blood vessel-forming cells to restore endothelial function in patients with vascular disease. We describe a protocol to convert human induced pluripotent stem cells (hiPSCs) or embryonic stem cells (hESCs) into cells similar to CB-ECFCs at an efficiency of >10(8) ECFCs produced from each starting pluripotent stem cell. The CB-ECFC-like cells display a stable endothelial phenotype with high clonal proliferative potential and the capacity to form human vessels in mice and to repair the ischemic mouse retina and limb, and they lack teratoma formation potential. We identify Neuropilin-1 (NRP-1)-mediated activation of KDR signaling through VEGF165 as a critical mechanism for the emergence and maintenance of CB-ECFC-like cells.


Figures

Figure 1
Figure 1
Simple one-step, 2D, serum-free, endothelial lineage differentiation protocol does not require embryoid body formation or TGF-β inhibition and yields ECFCs similar to those found in cord blood. (a) Schematic representation showing an estimation of generation of over a trillion cells in 61 d, starting from 104 hESCs or hiPSCs. Generation of 3 × 10⁴ NRP-1+CD31+ cells in 12 d is shown on left. A representative flow cytometry contour plot (bottom right) indicates the percent expression of NRP-1 and CD31 in day 12 differentiated cells. Day 12 NRP-1+CD31+ cells give rise to stable ECFC colonies that undergo extensive expansion. (b) Day 12 differentiated cells were sorted for NRP-1+CD31+ and NRP-1CD31+ cell fractions and cultured in transitioning media for endothelial growth. NRP-1+CD31+ cells gave rise to 60% more endothelial colonies (left panel) and 15-fold more total endothelial cells (right panel) compared to NRP-1CD31+ cells in 7 d of culture. n = 5; mean ± s.d. Student's t-test: ***P < 0.001. (c) A representative photomicrograph of ECFC colony obtained from NRP-1+CD31+ cell fraction exhibiting characteristic cobblestone morphology containing homogenous population of endothelial cells within each colony. Experiments were performed eight times in duplicate. Scale bars, 50 μm. (d) Representative immunofluorescence micrographs of ECFCs exhibiting cell surface expression for typical endothelial markers CD31, CD144 and NRP-1 and the nonendothelial marker α-SMA. Left, NRP-1 expression (red); CD31 (green). Right, α-SMA (green); CD144 (red). Nucleus (DAPI, blue). All experiments were performed three times in duplicate. Scale bars, 50 μm. (e) Clonal proliferative analysis of hESC-ECFCs and hiPSC-ECFCs in comparison with CB-ECFC control. The distribution pattern of colonies formed by clones of hESC-ECFCs and hiPSC-ECFCs formed HPPs (≥2,001 cells/well) and low PPs (51–2,000 cells/well) similar to levels produced by CB-ECFCs. n = 3; mean ± s.d. Student's t-test: P value not significant (ns). (f) Representative phase-contrast photomicrographs of hiPSC-ECFCs’ characteristic cobblestone morphology and formation of complete capillary networks on Matrigel similar to that exhibited by CB-ECFCs. All experiments were performed five times in duplicate. Scale bars, 100 μm. (g) ECFCs form durable and functional in vivo human vessels in immunodeficient mice. ECFCs (both from cord blood and hiPSCs) containing cellularized collagen gels were implanted in immunodeficient (NOD/SCID) mice in a subcutaneous pouch, recovered 14 d later, and fixed and stained. Arrows in the representative photomicrograph depict anti-human CD31+-stained functional human blood vessels that are perfused with circulating host mouse red blood cells. Scale bar, 50 μm. A bar graph represents quantification of functional hCD31+ vessels counted per mm2 in each group. n = 3; mean ± s.d. Student's t-test: ns.
Figure 2
Figure 2
Human iPSC-ECFCs contribute to vascular repair of both ischemic retina and limb. (a) Representative flat-mounted retinas of C57/BL6 mice injected with vehicle (left) or hiPSC-ECFCs (right). Retinal vasculature stained in green with Isolectin B4. Avascular area indicated by white line. All experiments were performed ≥4 times and percentage of avascular area calculated. Scale bars, 1 mm. (b) Representative flat-mounted retinas of C57/BL6 mice injected with vehicle (left) or hiPSC-EBT-CD144+ ECs (right). Retinal vasculature stained in green with Isolectin B4. Avascular area indicated by white line. All experiments were performed ≥4 times and percentage of avascular area calculated. Scale bars, 1 mm. (c) Representative pathological preretinal neovascularisation in C57/BL6 mice injected with vehicle (left) or hiPSC-ECFCs (right). Preretinal neovascular tufts predominately seen in vehicle-injected eyes when compared to contra lateral hiPSC-ECFCs–injected eyes. Arrows indicate preretinal neovascular tufts. All experiments were performed ≥4 times. Scale bars, 200 μm. (d) Representative laser Doppler perfusion imaging showing therapeutic neovascularization by hiPSC-ECFCs in athymic nude mice. A greater increase in limb blood perfusion was observed in the ischemic limbs (arrow) of mice that received hiPSC-ECFCs or CB-ECFCs transplantation than in the vehicle or hiPSC-EBT-CD144+ ECs-injection groups. All experiments were performed ≥10 times. (e) A stacked bar graph represents the percentage distribution of the physiological status of the instrumented ischemic limbs on day 28 post-implantation of vehicle, hiPSC-ECFCs, hiPSC-EBT-CD144+ ECs or CB-ECFCs. All experiments were performed ≥10 times. (f) A table represents the physiological status of the ischemic limbs on day 28 post-implantation of vehicle, hiPSC-ECFCs, hiPSC-EBT-CD144+ ECs or CB-ECFCs. All experiments were performed ≥10 times and values represent percentage limb salvage, necrosis or loss. Parametric Chi-squared test: *P < 0.05.
Figure 3
Figure 3
NRP-1 is critical for the emergence of ECFCs from hPSCs. (a) Schematic representation of the treatment strategy in examining the role of NRP-1 in the emergence of ECFCs from hPSCs. (b) Quantification of the percentage emergence of NRP-1+CD31+ (double)- positive cells following treatments with control (blue), Fc-NRP-1 (brown) and NRP-1-B (green) on days 10 and 12 of differentiation. A significantly increased percent emergence of double-positive cells was observed in the Fc-NRP-1–treated group compared to the control group. However, generation of double-positive cells was significantly lower in the NRP-1-B–treated group compared to the control. In the inset, a flow cytometry contour plot indicates the percent expression of KDR and NRP-1 in day 6 differentiated cells showing abundant KDR expression and diminished NRP-1 expression. n = 3; mean ± s.d. Student's t-test: **P < 0.01 and ***P < 0.001. (c) Western blots showing KDR, p130Cas and Pyk2 phosphorylation. Top, hPSCs undergoing ECFC differentiation were treated with Fc-control, Fc-NRP-1 dimer or NRP-1-B as described in a, starved, then stimulated with VEGF165. Cell lysates were treated with antibodies against phospho-KDR and total KDR. The expression of phosphor-KDR in NRP-1 dimer– and NRP-1-B–treated hiPSCs is shown in top blot and total KDR levels for each lane is depicted in the bottom blot. KDR phosphorylation was observed in VEGF-stimulated groups, and Fc-NRP-1 dimer treatment increased phosphorylation of KDR compared to control-treated cells. However, lower phosphorylation was observed in NRP-1-B–treated cells. Average band intensity value was normalized to total protein for each of the bands, and the normalized band intensity for each group compared with the VEGF-untreated group. In the bottom panels, hiPSCs undergoing ECFC differentiation were treated with the indicated concentration of Fc-control (C), Fc-NRP-1 dimer or NRP-1-B, starved, then stimulated with VEGF165. Cell lysates were treated with antibodies against phospho-p130Cas, phospho-Pyk2 and total Pyk2 and run on a western blot. Increased P-130Cas and Pyk2 phosphorylation was observed in a dose-dependent manner in the Fc-NRP-1 dimer–treated group compared to control-treated cells. However, lower P-130Cas and Pyk2 phosphorylation was observed in NRP-1-B–treated cells compared to control-treated cells. Average band intensity value was normalized to total protein for each of the bands and the normalized band intensity for each group compared with the band intensity for the control. All experiments were performed three times and representative cropped photomicrographs are shown with quantification of the band intensity at the bottom of each blot. Full-length blots are presented in Supplementary Figure 9.
Figure 4
Figure 4
NRP-1 is critical for the maintenance of ECFC proliferative potential. (a) Human PSC-ECFCs from different passages (P4, P14 and P18) were stained with monoclonal antibodies against CD31, CD144 and NRP-1. Percentages in each contour plot indicates CD31 and CD144 double-positive cells (left panel), whereas percentages in the right panel contour plot indicates CD31 and NRP-1 double-positive cells. The percentage of CD31/CD144 double-positive cells was maintained at higher levels in all of these different passages, whereas the percentage of NRP-1/CD31 double-positive cells progressively decreased in late passages. All experiments were performed four times in duplicate and a representative contour plot is shown for each group. (b) Fold expansion of hPSC-ECFCs when cells were counted at different passages (P4, P14 and P18) after 7 d of culture. Progressive loss in fold-expansion ability was observed in late-passage cells. n = 4; mean ± s.d. Student's t-test: ***P < 0.001. (c) P14 hPSC-ECFCs were stained with monoclonal antibodies against KDR and NRP-1. Percentages in each contour plot indicate NRP-1– and KDR-positive cells. Although more than 50% of the cells exhibited KDR expression, fewer than 17% cells exhibited NRP-1 expression. All experiments were performed four times in duplicate and a representative contour plot is shown. (d) Late passage (P14) hPSC-ECFCs were treated with control, Fc-NRP-1 and NRP-1-B to examine fold expansion after 3 or 7 d of treatment. A bar graph represents fold expansion of late passage (P14) hPSC-ECFCs following 3 (left bar graph) and 7 d (right bar graph) of treatment with control, Fc-NRP-1 and NRP-1-B. A significantly increased fold expansion was observed in Fc-NRP-1–treated cells both at day 3 and day 7 compared to control. However, a significantly decreased cell expansion was observed in the NRP-1-B–treated group both at day 3 and day 7 compared to control. n ≥ 3; mean ± s.d. Student's t-test: *P < 0.05, **P < 0.01 and ***P < 0.001. (e) Late passage (P14) hPSC-ECFCs were treated with control, Fc-NRP-1 and NRP-1-B for 7 d and were stained with β-galactosidase as per manufacturer's instruction. Fc-NRP-1 treatment decreased the number of β-galactosidase–positive blue cells (dotted circles) compared to control-treated cells. Whereas, NRP-1-B treatment increased the number of blue cells compared to control. All experiments were performed 4 times in triplicate and a representative photomicrograph is shown for each group. Scale bar, 50 μm. (f) Percentages of β-galactosidase–positive blue cells following the treatment of late passage (14) hPSC-ECFCs with control, Fc-NRP-1 and NRP-1-B for 7 d. A significantly decreased percentage of blue cells were observed in the Fc-NRP-1–treated group compared to control group. However, a significantly increased percentage of blue cells were observed in the NRP-1-B–treated group compared to control. n = 6; mean ± s.d. Student's t-test: **P < 0.01 and ***P < 0.001. (g) Late passage (p14) hPSC-ECFCs were cultured in regular EGM-2 media containing VEGF165 and EGM-2 media with VEGF121 and these cells were treated with control, Fc-NRP-1 and NRP-1-B for 7 d. After 7 d cells were collected, counted and stained with propidium iodide and annexin V to examine for live, proapoptotic, and dead cells in each of these treatment groups. A bar graph represents the percentage of proapoptotic cells in VEGF165 and VEGF121 containing media following 7 d of treatment with control, Fc-NRP-1 and NRP-1-B. A significantly decreased percentage of pro-apoptotic cells were observed in both Fc-NRP-1 and NRP-1-B treated groups in cells cultured in VEGF165 containing media compared to cells cultured in the presence of VEGF121. n ≥ 3; mean ± s.d. Student's t-test: **P < 0.01. (h) Late passage (P14) hPSC-ECFCs were cultured in EGM-2 media where regular VEGF165 was replaced with VEGF121 and these cells were treated with control, Fc-NRP-1 and NRP-1-B for 7 d. A bar graph represents fold expansion of late passage (14) hiPSC-ECFCs in VEGF121 treated media following 7 d of treatment with control, Fc-NRP-1 and NRP-1-B. Fc-NRP-1 and NRP-1-B treatment did not cause significant alteration in fold expansion in these cells compared to control in the presence of VEGF121. n = 4; mean ± s.d. Student's t-test; ns. (i) Late passage (p14) hPSC-ECFCs were cultured in regular EGM-2 media containing VEGF165 and EGM-2 media with VEGF121 and these cells were treated with control, Fc-NRP-1 and NRP-1-B for 7 d. After 7 d, cells were collected, counted and stained with propidium iodide and annexin V to examine for live, proapoptotic and dead cells in each of these treatment groups. Percentages in each contour plots represent live, proapoptotic and dead cells in control (left panels), Fc-NRP-1– (middle panels) and NRP-1-B– (right panels) treated cells in the presence of VEGF121 (panels on top row) or VEGF165 (panels on bottom row). In the VEGF121-treated cells, both Fc-NRP-1 and NRP-1-B increased the percentage of dead and pro-apoptotic cells compared to control. However, in VEGF165-treated cells, while Fc-NRP-1 decreased the percentages of both dead and proapoptotic cells and increased the percentage of live cells compared to control, NRP-1-B increased the percentages of both dead and proapoptotic cells and decreased the percentage of live cells compared to control. All experiments were performed four times in triplicate and a representative contour plot is shown for each group.

References

    1. Lin Y, Weisdorf DJ, Solovey A, Hebbel RP. Origins of circulating endothelial cells and endothelial outgrowth from blood. J. Clin. Invest. 2000;105:71–77. - PMC - PubMed
    1. Medina RJ, O'Neill CL, Humphreys MW, Gardiner TA, Stitt AW. Outgrowth endothelial cells: characterization and their potential for reversing ischemic retinopathy. Invest. Ophthalmol. Vis. Sci. 2010;51:5906–5913. - PubMed
    1. Moubarik C, et al. Transplanted late outgrowth endothelial progenitor cells as cell therapy product for stroke. Stem Cell Rev. 2011;7:208–220. - PubMed
    1. Yoder MC, et al. Redefining endothelial progenitor cells via clonal analysis and hematopoietic stem/progenitor cell principals. Blood. 2007;109:1801–1809. - PMC - PubMed
    1. Ingram DA, et al. Vessel wall-derived endothelial cells rapidly proliferate because they contain a complete hierarchy of endothelial progenitor cells. Blood. 2005;105:2783–2786. - PubMed

Publication types

Substances

Associated data