

Calorie changes in chain restaurant menu items: implications for obesity and evaluations of menu labeling
- PMID: 25306397
- PMCID: PMC4274249
- DOI: 10.1016/j.amepre.2014.08.026
Calorie changes in chain restaurant menu items: implications for obesity and evaluations of menu labeling
Abstract
Background: Supply-side reductions to the calories in chain restaurants are a possible benefit of upcoming menu labeling requirements.
Purpose: To describe trends in calories available in large U.S. restaurants.
Methods: Data were obtained from the MenuStat project, a census of menu items in 66 of the 100 largest U.S. restaurant chains, for 2012 and 2013 (N=19,417 items). Generalized linear models were used to calculate (1) the mean change in calories from 2012 to 2013, among items on the menu in both years; and (2) the difference in mean calories, comparing newly introduced items to those on the menu in 2012 only (overall and between core versus non-core items). Data were analyzed in 2014.
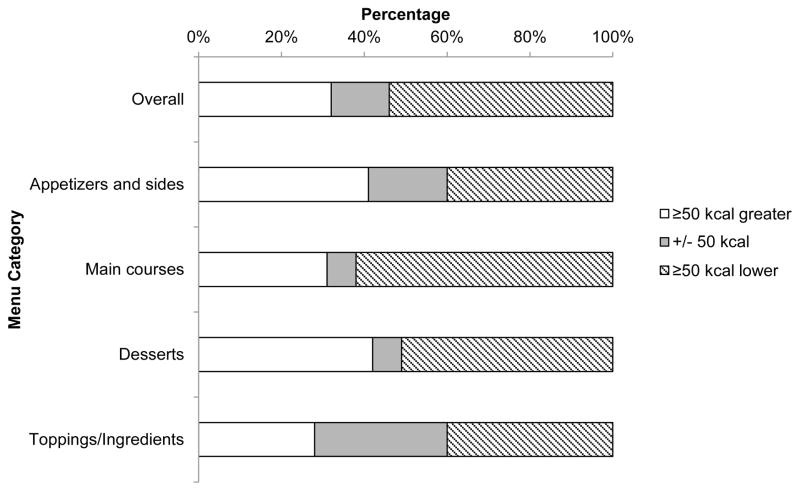
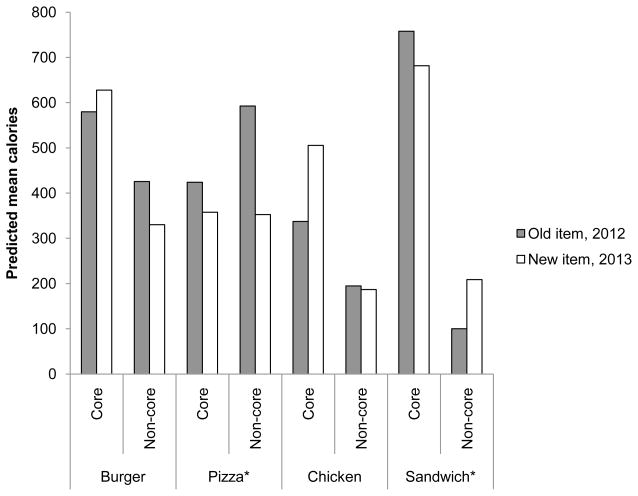
Results: Mean calories among items on menus in both 2012 and 2013 did not change. Large restaurant chains in the U.S. have recently had overall declines in calories in newly introduced menu items (-56 calories, 12% decline). These declines were concentrated mainly in new main course items (-67 calories, 10% decline). New beverage (-26 calories, 8% decline) and children's (-46 calories, 20% decline) items also had fewer mean calories. Among chain restaurants with a specific focus (e.g., burgers), average calories in new menu items not core to the business declined more than calories in core menu items.
Conclusions: Large chain restaurants significantly reduced the number of calories in newly introduced menu items. Supply-side changes to the calories in chain restaurants may have a significant impact on obesity prevention.
Copyright © 2015 American Journal of Preventive Medicine. Published by Elsevier Inc. All rights reserved.
Conflict of interest statement
The authors declare no conflicts of interest.
Figures
References
-
- Bleich S, Cutler D, Murray C, Adams A. Why Is the Developed World Obese? Annu Rev Public Health. 2008;29:273–295. - PubMed
-
-
Patient Protection and Affordable Care Act. In: Public Law 111–148; 2010.
-
-
- Schreiner B. USA Today. 2008. Yum Brands to add calorie info to menu boards.
-
- Wu HW, Sturm R. Changes in the energy and sodium content of main entrees in US chain restaurants from 2010 to 2011. J Acad Nutr Diet. 2014;114(2):209–19. - PubMed
-
- Bruemmer B, Krieger J, Saelens BE, Chan N. Energy, saturated fat, and sodium were lower in entrees at chain restaurants at 18 months compared with 6 months following the implementation of mandatory menu labeling regulation in King County, Washington. J Acad Nutr Diet. 2012;112(8):1169–76. - PubMed
Publication types
MeSH terms
Grants and funding
LinkOut - more resources
Full Text Sources
Other Literature Sources
Medical
