. 2014 Nov;17(11):1613-22.
doi: 10.1038/nn.3836. Epub 2014 Oct 12.

Hierarchical competitions subserving multi-attribute choice

Affiliations

Hierarchical competitions subserving multi-attribute choice

Laurence T Hunt et al. Nat Neurosci. 2014 Nov.

Abstract

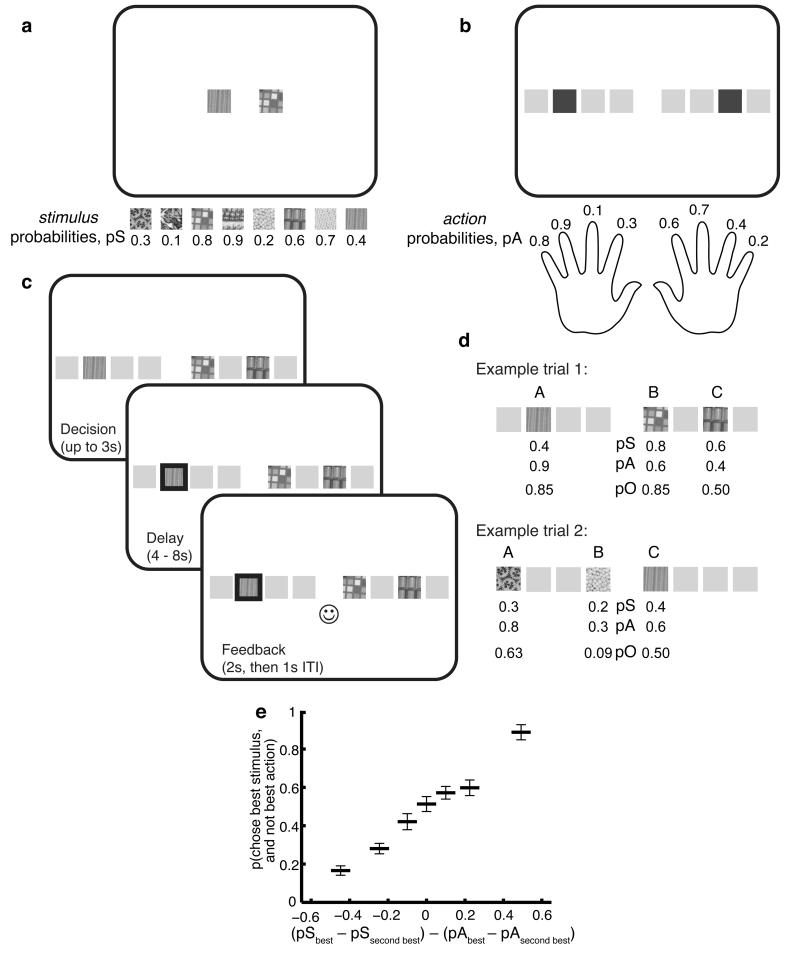
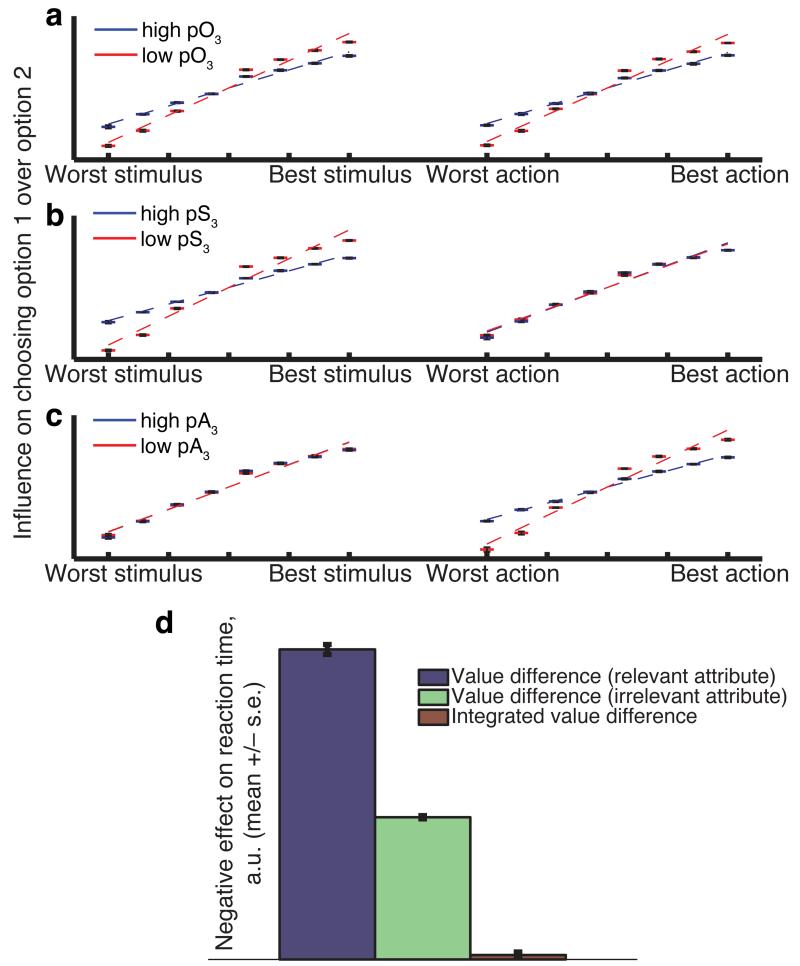
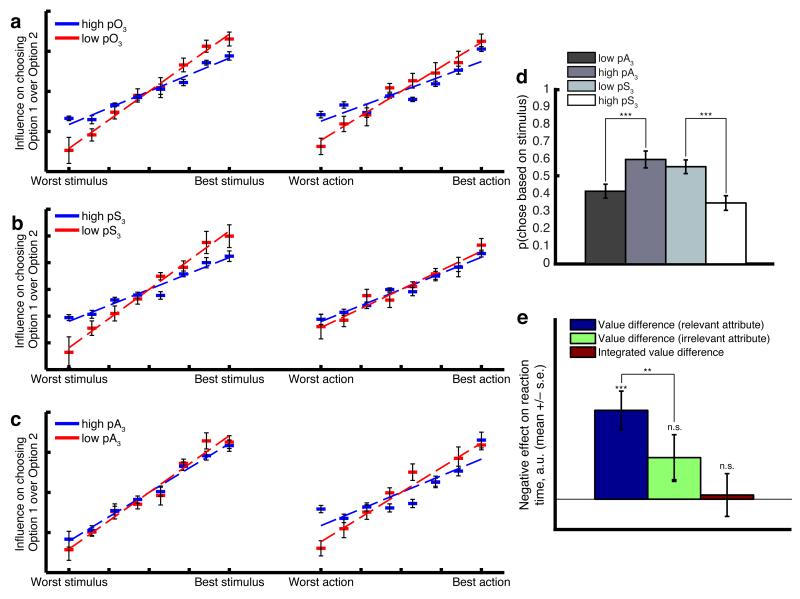
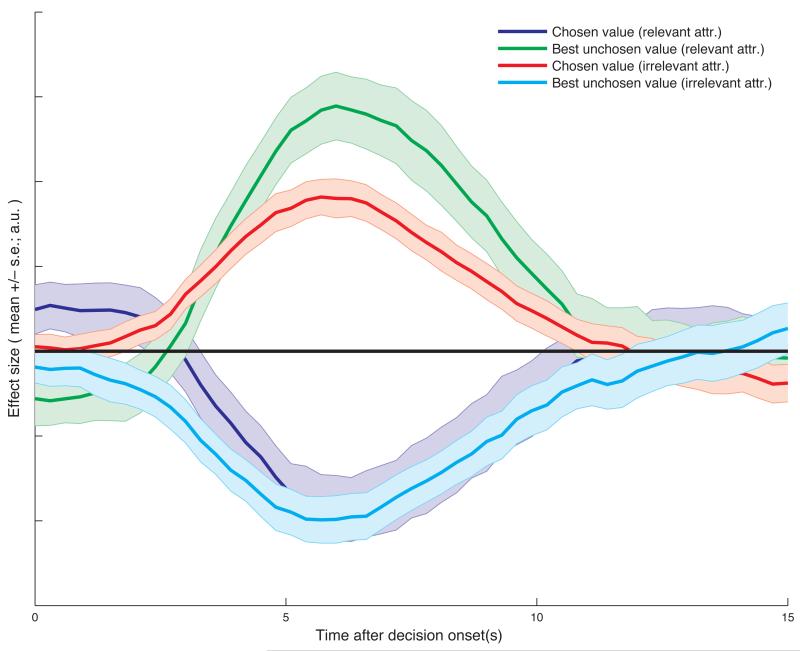
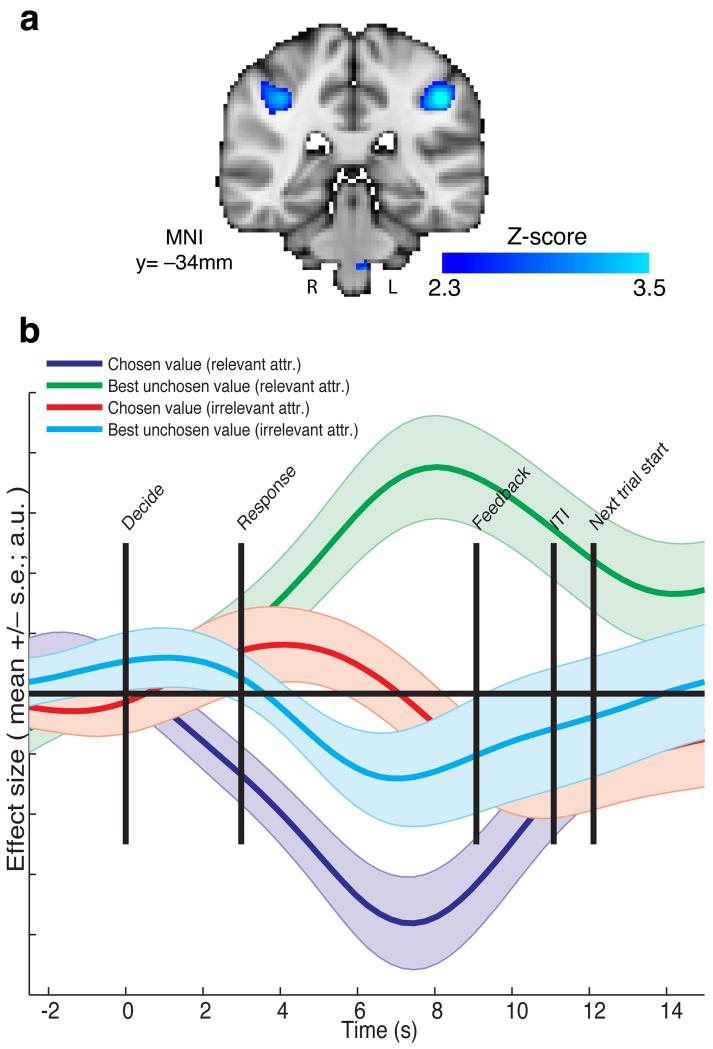
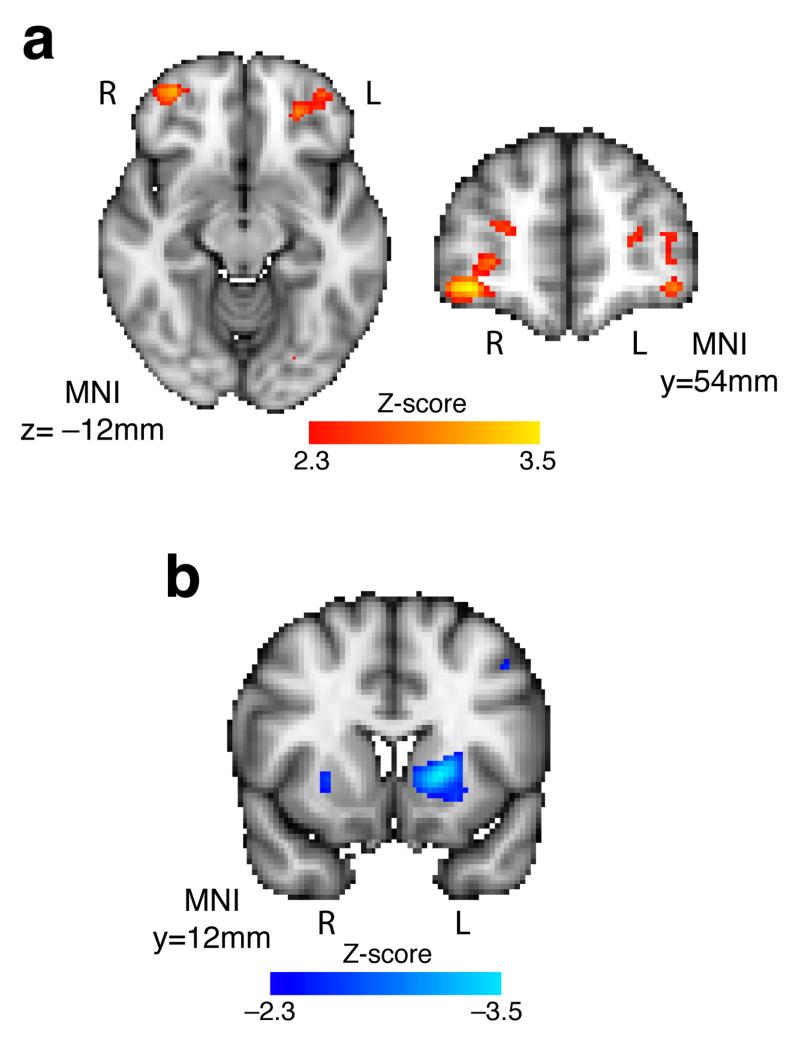
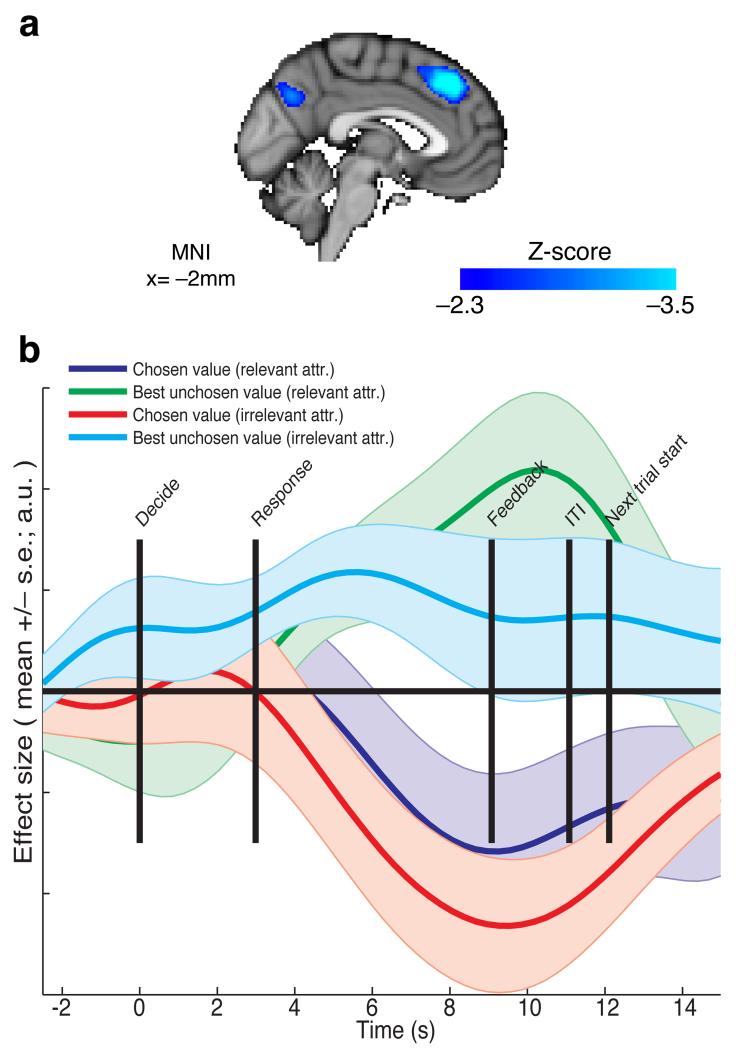
Valuation is a key tenet of decision neuroscience, where it is generally assumed that different attributes of competing options are assimilated into unitary values. Such values are central to current neural models of choice. By contrast, psychological studies emphasize complex interactions between choice and valuation. Principles of neuronal selection also suggest that competitive inhibition may occur in early valuation stages, before option selection. We found that behavior in multi-attribute choice is best explained by a model involving competition at multiple levels of representation. This hierarchical model also explains neural signals in human brain regions previously linked to valuation, including striatum, parietal and prefrontal cortex, where activity represents within-attribute competition, competition between attributes and option selection. This multi-layered inhibition framework challenges the assumption that option values are computed before choice. Instead, our results suggest a canonical competition mechanism throughout all stages of a processing hierarchy, not simply at a final choice stage.


Figures

Figure 1
Figure 1
Experimental task design. (a) Outside scanner, subjects learned reward probabilities (pS) associated with 8 stimuli, via pairwise choices between stimuli. Subjects trained to reach a minimum performance criterion of 90% correct (choosing higher valued stimulus). (b) Subjects also learned reward probabilities (pA) associated with 8 actions (finger presses), via pairwise choices between actions (dark grey squares indicate currently available actions; each action tied to an onscreen spatial location). Subjects trained to same criteria as for stimuli. Stimulus and action training was alternated in blocks of at least 70 trials, with an additional 40 trial ‘refresher’ block immediately prior to the fMRI experiment. (c) Inside the scanner, subjects performed a three-option choice experiment, in which each option comprised one previously learned stimulus and one previously learned action. Subjects were instructed to weight stimulus and action information equally on each trial, and select the best option to obtain points that subsequently converted into monetary reward (see methods). Reward was delivered probabilistically according to pO, the optimal combination of pS and pA (see equation 1 in methods), for the chosen option. (d) Two example trials. In trial 1, options A and B are of equal (integrated) value. The action attribute favors option A and so would be deemed ‘relevant’ if A were chosen, and stimulus deemed ‘irrelevant’. The converse would be true if option B were chosen. Were option C chosen, the trial would be discarded from fMRI analysis. In trial 2, action would be deemed relevant if A were chosen, whereas stimulus would be deemed relevant if C were chosen. (e) Choice behavior. On trials where stimulus and action favor different options, the probability of choosing the option favored by the stimulus attribute (ordinate) is plotted as a function of the difference in probabilities on the two dimensions (abscissa). Bars show mean +/− s.e.m. across 19 subjects.
Figure 2
Figure 2
Predictions of behavior from hierarchical model. (a)-(c) Distractor effects, described in text and elucidated in subject behavior in figure 3(a)-(c). A distractor effect is where option 3 value affects choice probabilities between options 1 and 2, here assessed via logistic regression. The model shows a classic value-based distractor effect (a), but also a within-attribute distractor effect (b/c), as is found in subject behavior. (d) Reaction time effects in model estimated via linear regression, comparable to those revealed in subject behavior in figure 3(e). The model is most heavily influenced by value difference on the relevant attribute, not the irrelevant attribute or integrated values.
Figure 3
Figure 3
Subject behavior (n=19 subjects). (a) Value-based distractor effect – high values of option 3 make options 1 and 2 less discriminable. Datapoints show mean +/− s.e.m. (across subjects) of logistic regression parameters for each of the 16 stimuli/actions on the probability of choosing option 1 vs option 2 (see methods for details). Trials have been split into those where the 3rd option has a high value, and those where it has a low value. Red points show effects when option 3 pO is high (in top 33% of values), blue points when option 3 pO is low (in bottom 33%). Lines show average best fit to datapoints; the slope of this line is significantly different between high pO3 vs low pO3 (T(18)=3.17, p=0.0053 (stimulus influence); T(18)=2.45, p=0.025 (action influence)). (b) When option 3 is split selectively on the stimulus attribute, the distractor effect remains on the stimulus discriminability of options 1 and 2 (T(18)=2.51, p=0.021), but not on the action discriminability (T(18)=0.82, p=0.42). (c) When option 3 is split selectively on the action attribute, the distractor effect remains on the action attribute (T(18)=3.18, p=0.0052), but not on the stimulus attribute (T(18)=1.78, p=0.092). (d) Analysis of trials where evidence given by stimulus and action are equal and opposite. Probability of choosing option 1, on trials where pS1>pS2, pA2>pA1, and (pS1-pS2)≈(pA2-pA1). On such trials, ‘choosing based on stimulus’ (plotted on ordinate) is equivalent to ‘choosing option 1’. Option 3 is always one of the two unchosen options. Bars show mean +/− s.e. (across subjects). *** denotes p=8.5*10−4, paired T-test between low and high pR3 (T(18)=−3.99) and p=9.0*10−6, paired T-test between low and high pS3 (T(18)=6.11). Interaction in two-way ANOVA, F(1,72) = 16.62, p=1.7*10−4. (e) Reaction times are more heavily influenced by the relevant attribute than the irrelevant attribute. Bars show mean +/− s.e.m. (across subjects) of effects of value difference on subject reaction times, estimated via linear regression (y-axis is flipped – i.e. higher value differences typically elicit faster reaction times). *** denotes p=2.13*10−4, one-sample T-test (T(18)=4.62); ** denotes p=0.0030, paired T-test (T(18)=3.43)); n.s. = non-significant one-sample T-test.
Figure 4
Figure 4
Model predictions of fMRI data, derived from ‘attribute comparison’ node of the hierarchical model. Model activity from each trial was convolved with a haemodynamic response function, and then regressed against chosen value and best unchosen value on both relevant and irrelevant attributes (together with a constant term, and model reaction time included as a coregressor of no interest). Bars show mean +/− s.e.m. of parameter estimates from the regression across 10 simulations of the model. The contrast (chosen value – best unchosen value)irrelevant - (chosen value – best unchosen value)relevant is encoded by the model.
Figure 5
Figure 5
Intraparietal sulcus shows features of an attribute comparison signal, with opposing signs for relevant and irrelevant attributes. (a) Statistical parametric map of the contrast (chosen value – best unchosen value)irrelevant - (chosen value – best unchosen value)relevant, at the time of making the decision, thresholded at Z>2.3 uncorrected for display purposes (n=19 subjects). A bilateral portion of IPS reflects this contrast, with the left IPS surviving whole-brain correction (FWE-corrected p=0.0023, cluster-forming threshold Z>2.3; peak Z=3.65, MNI=−38,−42,40mm). (b) Timeseries analysis of this region, time-locked to decision phase, reveals negative correlates of (chosen value)irrelevant and positive correlates of (best unchosen value)relevant, but positive correlates of (chosen value)relevant and negative correlates of (best unchosen value)irrelevant (bars show mean +/− s.e. across subjects). To avoid circular analysis, a leave-one-out cross-validation approach was used for timeseries extraction (see methods).
Figure 6
Figure 6
Psychophysiological interaction with intraparietal cortex. (a) Functional connectivity with a bilateral portion of the anterior/lateral orbitofrontal cortex was greater on trials where stimulus was the relevant attribute relative to trials where action was the relevant attribute (peak Z = 3.52; MNI = 36,52,−10 mm (right OFC); peak Z = 2.91, MNI = −26,42,−12mm (left OFC); all voxels with Z>2.3 shown, both clusters contained >100 voxels at this threshold) (n=19 subjects). (b) Functional connectivity with a portion of the left putamen was greater on trials where action was the relevant attribute relative to trials where stimulus was the relevant attribute (peak Z = −3.46; MNI = −18,12,2 mm; all voxels with Z>2.3 shown, the left putamen contained >100 voxels at this threshold, whilst the right putamen showed a similar, smaller activation).
Figure 7
Figure 7
Dorsal medial frontal cortex shows an integrated value difference signal, with the same sign for both relevant and irrelevant attributes. (a) Statistical parametric map of the contrast (chosen value – best unchosen value)relevant + (chosen value – best unchosen value)irrelevant, at the time of making the decision, thesholded at Z<−2.3 uncorrected for display purposes. A portion of dorsal medial frontal cortex reflects this contrast (FWE-corrected p=0.0054, cluster-forming threshold Z<−2.3; peak Z=−3.85, MNI=−2,34,46mm). Other regions surviving whole-brain correction are detailed in table S3. (n=19 subjects) (b) Timeseries analysis of this region, time-locked to decision phase, reveals negative correlates of both (chosen value)relevant and (chosen value)irrelevant, and positive correlates of (best unchosen value)relevant and (best unchosen value)irrelevant (bars show mean +/− s.e. across subjects), slightly delayed in time relative to attribute comparison signal in IPS (compare to figure 5b). As before, cross-validated ROIs were used for timeseries extraction (see methods).

References

    1. Bettman JR. Constructive consumer choice processes. J Consum Res. 1998;25:187–217.
    1. Mcfarland DJ, Sibly RM. Behavioral Final Common Path. Philos T Roy Soc B. 1975;270:265–293. - PubMed
    1. Camerer CF, Fehr E. When does “economic man” dominate social behavior? Science. 2006;311:47–52. - PubMed
    1. Keeney RL, Raiffa H. Decisions with multiple objectives: preferences and value functions. Cambridge University Press; Cambridge: 1993.
    1. Rangel A, Camerer C, Montague PR. A framework for studying the neurobiology of value-based decision making. Nat Rev Neurosci. 2008;9:545–556. - PMC - PubMed

Additional references for online methods

    1. Sutton RS, Barto AG. Reinforcement learning: an introduction. MIT Press; 1998.
    1. Weiskopf N, Hutton C, Josephs O, Deichmann R. Optimal EPI parameters for reduction of susceptibility-induced BOLD sensitivity losses: a whole-brain analysis at 3 T and 1.5 T. Neuroimage. 2006;33:493–504. - PubMed
    1. Woolrich MW, et al. Bayesian analysis of neuroimaging data in FSL. Neuroimage. 2009;45:S173–186. - PubMed
    1. Behrens TE, Hunt LT, Woolrich MW, Rushworth MF. Associative learning of social value. Nature. 2008;456:245–249. - PMC - PubMed

Publication types

LinkOut - more resources