. 2014 Oct 23;159(3):635-46.
doi: 10.1016/j.cell.2014.09.039. Epub 2014 Oct 9.

A protein-tagging system for signal amplification in gene expression and fluorescence imaging

Affiliations

A protein-tagging system for signal amplification in gene expression and fluorescence imaging

Marvin E Tanenbaum et al. Cell. .

Abstract

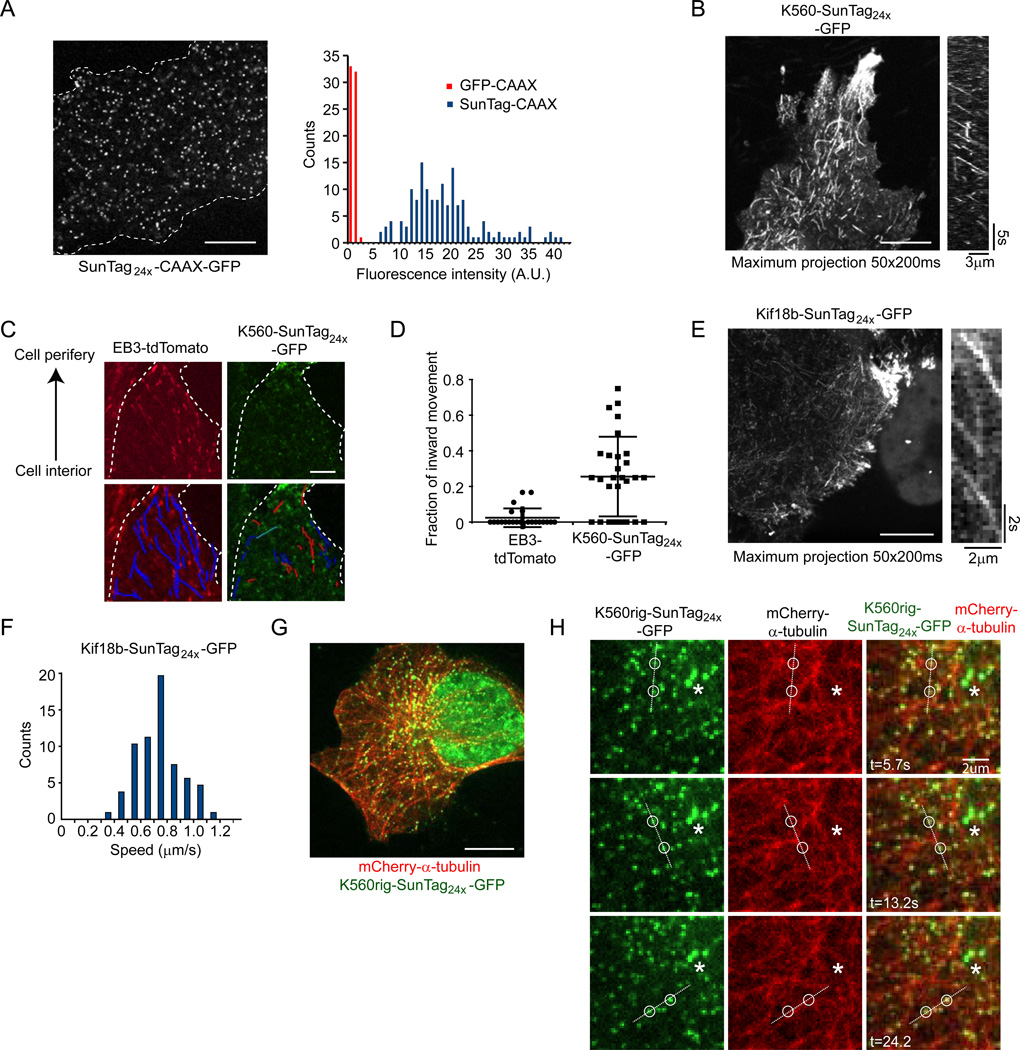
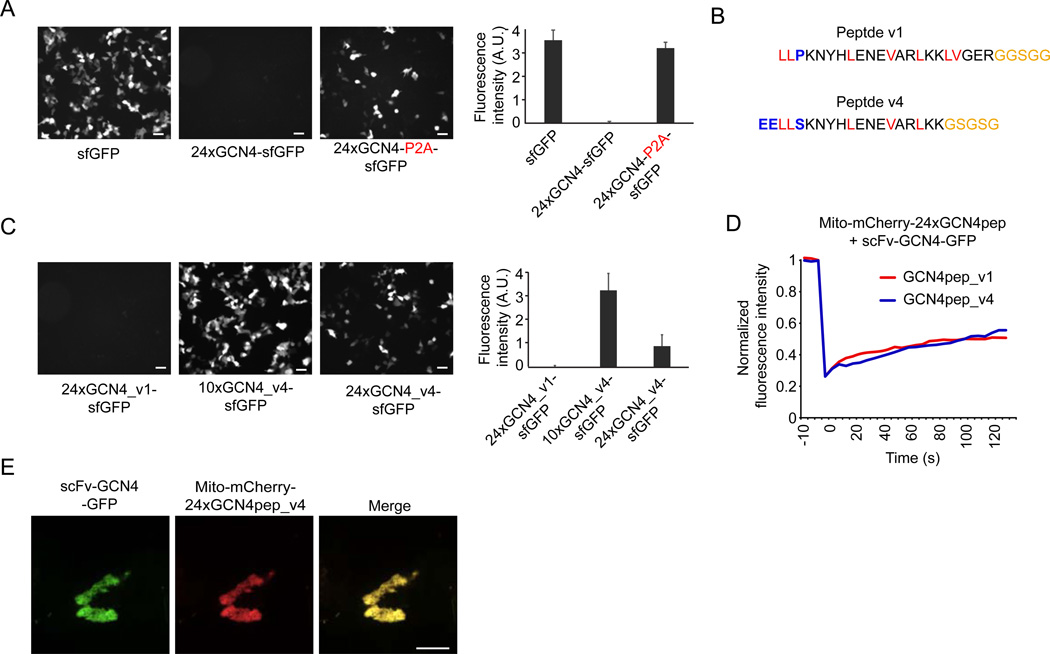
Signals in many biological processes can be amplified by recruiting multiple copies of regulatory proteins to a site of action. Harnessing this principle, we have developed a protein scaffold, a repeating peptide array termed SunTag, which can recruit multiple copies of an antibody-fusion protein. We show that the SunTag can recruit up to 24 copies of GFP, thereby enabling long-term imaging of single protein molecules in living cells. We also use the SunTag to create a potent synthetic transcription factor by recruiting multiple copies of a transcriptional activation domain to a nuclease-deficient CRISPR/Cas9 protein and demonstrate strong activation of endogenous gene expression and re-engineered cell behavior with this system. Thus, the SunTag provides a versatile platform for multimerizing proteins on a target protein scaffold and is likely to have many applications in imaging and controlling biological outputs.


Figures

Figure 1
Figure 1. Identification of an antibody-peptide pair that binds tightly in vivo
(A–B) Schematic of the antibody-peptide labeling strategy. (B) schematic of the experiment described in (C) in which the mitochondrial targeting domain of mitoNEET (yellow box, mito) fused to mCherry and 4 tandem copies of a peptide recruits a GFP-tagged intracellular antibody to mitochondria (C) ScFv-GCN4-GFP was co-expressed with either mito-mCherry-4xGCN4peptide (lower panel) or mito-mCherry-FKBP as a control (upper panel) in U2OS cells, and cells were imaged using spinning disk confocal microscopy. Scale bars, 10 µm. See also figure S1.
Figure 2
Figure 2. Characterization of the off-rate and stoichiometry of the binding interaction between the scFv-GCN4 antibody and the GCN4 peptide array in vivo
(A) Mito-mCherry-24xGCN4pep was co-transfected with scFv-GCN4-GFP in HEK293 cells and their co-localization on mitochondria in a single cell is shown (−10 sec). At 0 sec, the mitochondria-localized GFP signal was photobleached in a single Z-plane using a 472nm laser, and fluorescence recovery was followed by time-lapse microscopy. Scale bar, 5 µm. (B) The fluorescence recovery after photobleaching (FRAP) was quantified for 20 cells. (C–E) Indicated constructs were transfected in HEK293 cells and images were acquired 24 hr after transfection with identical image acquisition settings. Representative images are shown in (C). Note that the GFP signal intensity in the mito-mCherry-24xGCN4pep + scFv-GCN4-GFP is highly saturated when the same scaling is used as in the other panels. Bottom row shows a zoom of a region of interest: dynamic scaling was different for the GFP and mCherry signals, so that both could be observed. Scale bars, 10 mm. (D–E) Quantifications of the GFP:mCherry fluorescence intensity ratio on mitochondria after normalization. Each dot represents a single cell and dashed lines indicates the average value. See also figure S2.
Figure 3
Figure 3. The SunTag allows long-term single molecule fluorescence imaging in the cytoplasm
(A–H) U2OS cells were transfected with indicated SunTag24x constructs together with the scFv-GCN4-GFP-NLS, and were imaged by spinning disk confocal microscopy 24 hr after transfection. (A) A representative image of SunTag24x-CAAX-GFP is shown (left), as well as the fluorescence intensities quantification of the foci (right, blue bars). As a control, U2OS were transfected with sfGFP-CAAX and of fluorescence intensities of single sfGFP-CAAX molecules were also quantified (red bars). The average fluorescence intensity of the single sfGFP-CAAX was set to 1. Dotted line marks the outline of the cell (left). Scale bar, 10 mm. (B) Cells expressing K560-SunTag24x–GFP were imaged by spinning disk confocal microscopy (image acquisition every 200 ms). Movement is revealed by a maximum intensity projection of 50 time-points (left) and a kymograph (right). Scale bar, 10 µm. (C–D) Cells expressing both EB3-tdTomato and K560-SunTag24x–GFP were imaged and moving particles were tracked manually. Red and blue tracks (lower panel) indicate movement towards the cell interior and periphery, respectively (C). The duration of the movie was 20 s. Scale bar, 5 µm. Dots in (D) represent individual cells with between 5–20 moving particles scored per cell. The mean and standard deviation is indicated. (E–F) Cells expressing Kif18b–SunTag24x–GFP were imaged with a 250 ms time interval. Images in (E) show a maximum intensity projection (50 time-points, left) and a kymograph (right). Speeds of moving molecules was quantified from 10 different cells (F). Scale bar, 10 µm. (G–H) Cells expressing both mCherry-α-tubulin and K560rig-SunTag24x–GFP were imaged with a 600 ms time interval. The entire cell is shown in (G), while H shows zoomed-in stills of a time series from the same cell. Open circles track two foci on the same microtubule, which is indicated by the dashed line. Asterisks indicate stationary foci. Scale bars, 10 and 2 µm (G and H), respectively. See also figure S3 and Movies S1–S6.
Figure 4
Figure 4. An optimized peptide array for high expression
(A) Indicated constructs were transfected in HEK293 cells and imaged 24 hr after transfection using wide-field microscopy. All images were acquired using identical acquisition parameters. Representative images are shown (left) and fluorescence intensities were quantified (n=3) (right). (B) Sequence of the first and second generation GCN4 peptide (modified or added residues are colored blue, hydrophobic residues are red and linker residues are yellow). (C–E) Indicated constructs were transfected in HEK293 cells and imaged 24 hr after transfection using widefield (C) or spinning disk confocal (D–E) microscopy. (C) Representative images are shown (left) and fluorescence intensities were quantified (n=3) (right). (D–E) GFP signal on mitochondria was photobleached and fluorescence recovery was determined over time. The graph (E) represents an average of 6 cells per condition. (E) shows an image of a representative cell before photobleaching. Scale bars in (A,C), 50 µm, scale bars in (D,E), 10 µm. See also Movie S7.
Figure 5
Figure 5. dCas9-SunTag allows genetic rewiring of cells through activation of endogenous genes
(A) Schematic of gene activation by dCas9-VP64 and dCas9-SunTag-VP64. dCas9 binds to a gene promoter through its sequence specific sgRNA (red line). Direct fusion of VP64 to dCas9 (top) results in a single VP64 domain at the promoter which poorly activates transcription of the downstream gene. In contrast, recruitment of many VP64 domains using the SunTag potently activates transcription of the gene (bottom). (B–D) K562 cells stably expressing dCas9-VP64 or dCas9-SunTag10x-VP64 were infected with lentiviral particles encoding indicated sgRNAs, as well as BFP and a puromycin resistance gene and selected with 0.7 µg/ml puromycin for 3 days to kill uninfected cells. (B–C) Cells were stained for CXCR4 using a directly labeled α-CXCR4 antibody and fluorescence was analyzed by FACS. (D) Trans-well migration assays (see experimental procedures) were performed with indicated sgRNAs. Results are displayed as the fold change in directional migrating cells over control cell migration. (E) dCas9-VP64 or dCas9-SunTag10x-VP64 induced transcription of CDKN1B with several sgRNAs. mRNA levels were quantified by qPCR. (F) Doubling time of control cells or cells expressing indicated sgRNAs was determined (See Experimental Procedures section). Graphs in (C, D and F) are averages of three independent experiments. Graph in (E) is average of two biological replicates, each with two or three technical replicates. All error bars indicated standard error of the mean (SEM). See also figure S4.

References

    1. Akhmanova A, Steinmetz MO. Tracking the ends: a dynamic protein network controls the fate of microtubule tips. Nature reviews Molecular cell biology. 2008;9:309–322. - PubMed
    1. Anderson GM, Freytag SO. Synergistic activation of a human promoter in vivo by transcription factor Sp1. Molecular and cellular biology. 1991;11:1935–1943. - PMC - PubMed
    1. Baum M, Erdel F, Wachsmuth M, Rippe K. Retrieving the intracellular topology from multi-scale protein mobility mapping in living cells. Nature communications. 2014;5:4494. - PMC - PubMed
    1. Berger C, Weber-Bornhauser S, Eggenberger J, Hanes J, Pluckthun A, Bosshard HR. Antigen recognition by conformational selection. FEBS letters. 1999;450:149–153. - PubMed
    1. Bertrand E, Chartrand P, Schaefer M, Shenoy SM, Singer RH, Long RM. Localization of ASH1 mRNA particles in living yeast. Molecular cell. 1998;2:437–445. - PubMed

Publication types