

SHORT-RUN SUBSIDIES AND LONG-RUN ADOPTION OF NEW HEALTH PRODUCTS: EVIDENCE FROM A FIELD EXPERIMENT
- PMID: 25308977
- PMCID: PMC4193678
- DOI: 10.3982/ECTA9508
SHORT-RUN SUBSIDIES AND LONG-RUN ADOPTION OF NEW HEALTH PRODUCTS: EVIDENCE FROM A FIELD EXPERIMENT
Abstract
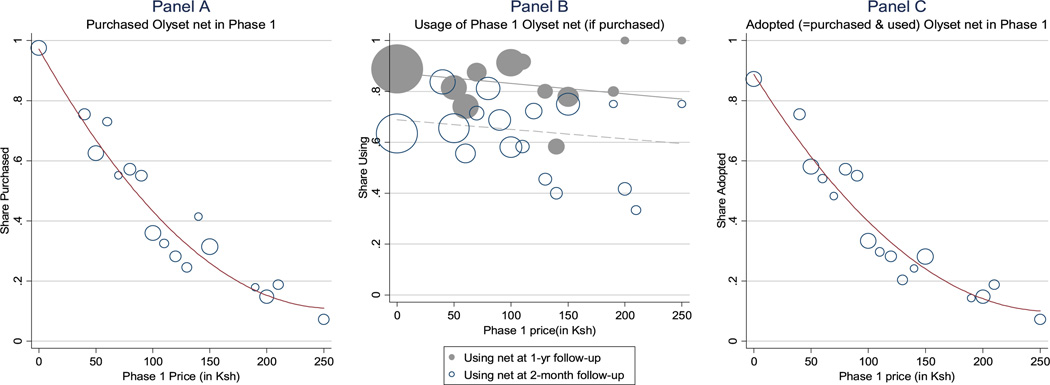
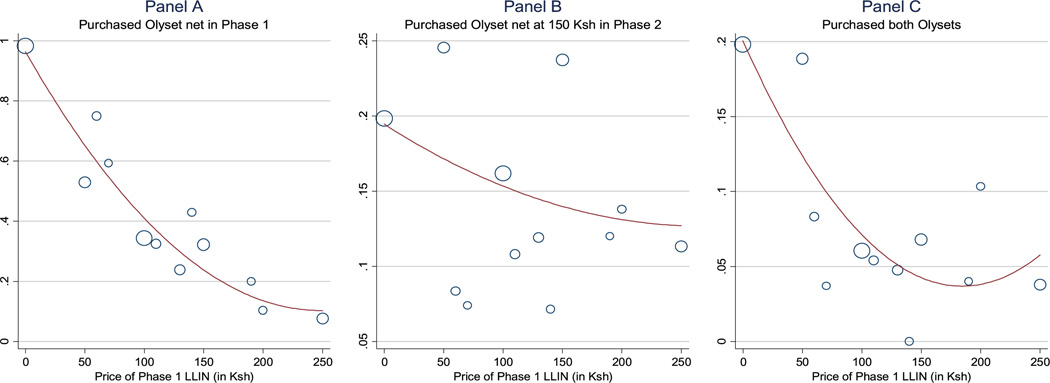
Short-run subsidies for health products are common in poor countries. How do they affect long-run adoption? A common fear among development practitioners is that one-off subsidies may negatively affect long-run adoption through reference-dependence: People might anchor around the subsidized price and be unwilling to pay more for the product later. But for experience goods, one-off subsidies could also boost long-run adoption through learning. This paper uses data from a two-stage randomized pricing experiment in Kenya to estimate the relative importance of these effects for a new, improved antimalarial bed net. Reduced form estimates show that a one-time subsidy has a positive impact on willingness to pay a year later inherit. To separately identify the learning and anchoring effects, we estimate a parsimonious experience-good model. Estimation results show a large, positive learning effect but no anchoring. We black then discuss the types of products and the contexts inherit for which these results may apply.
Keywords: Technology adoption; anchoring; experimentation; malaria; prevention; social learning.
Figures
References
-
- Ariely D, Loewenstein G, Prelec D. Coherent Arbitrariness: Stable Demand Curves Without Stable Preferencesa. Quarterly Journal of Economics. 2003;118(1):73–106.
-
- Ashraf N, Berry J, Shapiro J. Can Higher Prices Stimulate Product Use? Evidence From a Field Experiment in Zambia. American Economic Review. 2010;100(5):2383–2413.
-
- Bergemann D, Välimäki J. Experimentation in Markets. The Review of Economic Studies. 2000;67(2):213–234.
-
- Bergemann D, Välimäki J. Dynamic Pricing of New Experience Goods. The Journal of Political Economy. 2006;114(4):713–743.
Grants and funding
LinkOut - more resources
Full Text Sources
Other Literature Sources