

The relationship between self-report of depression and media usage
- PMID: 25309388
- PMCID: PMC4162355
- DOI: 10.3389/fnhum.2014.00712
The relationship between self-report of depression and media usage
Abstract
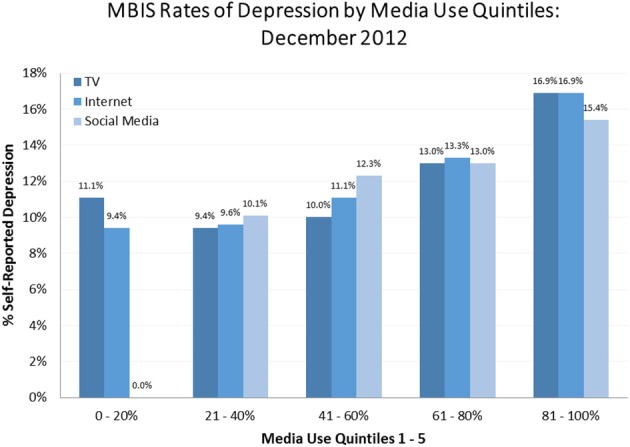
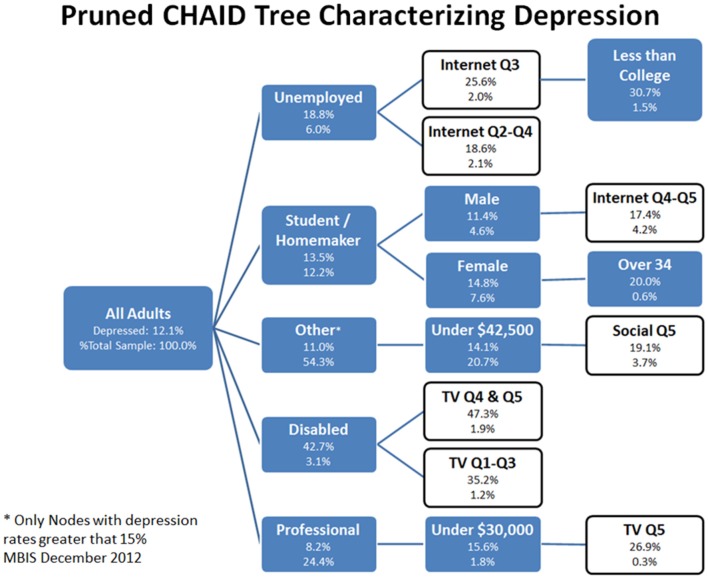
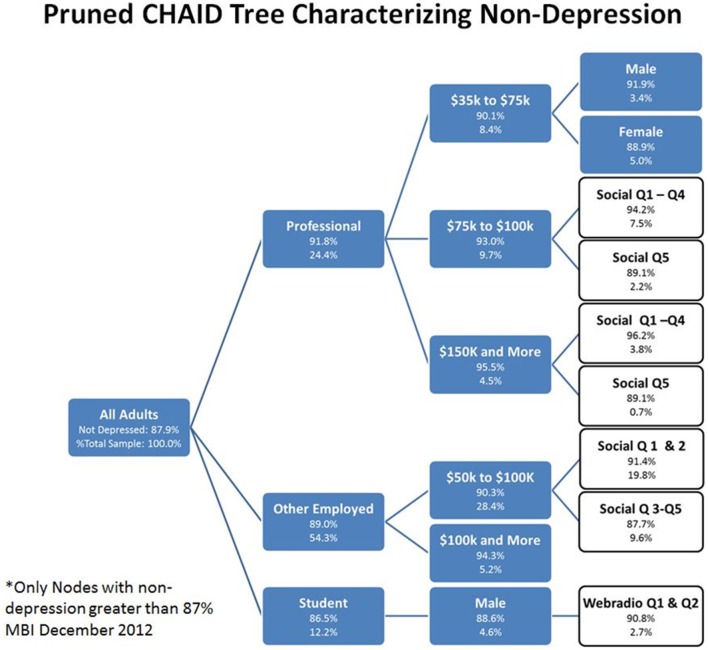
Depression is a debilitating condition that adversely affects many aspects of a person's life and general health. Earlier work has supported the idea that there may be a relationship between the use of certain media and depression. In this study, we tested if self-report of depression (SRD), which is not a clinically based diagnosis, was associated with increased internet, television, and social media usage by using data collected in the Media Behavior and Influence Study (MBIS) database (N = 19,776 subjects). We further assessed the relationship of demographic variables to this association. These analyses found that SRD rates were in the range of published rates of clinically diagnosed major depression. It found that those who tended to use more media also tended to be more depressed, and that segmentation of SRD subjects was weighted toward internet and television usage, which was not the case with non-SRD subjects, who were segmented along social media use. This study found that those who have suffered either economic or physical life setbacks are orders of magnitude more likely to be depressed, even without disproportionately high levels of media use. However, among those that have suffered major life setbacks, high media users-particularly television watchers-were even more likely to report experiencing depression, which suggests that these effects were not just due to individuals having more time for media consumption. These findings provide an example of how Big Data can be used for medical and mental health research, helping to elucidate issues not traditionally tested in the fields of psychiatry or experimental psychology.
Keywords: big data; depression; marketing communications; media use.
Figures
References
-
- Ahuvia A. C. (2005). Beyond the extended self: loved objects and consumers' identity narratives. J. Consum. Res. 32, 171–184 10.1086/429607 - DOI
-
- Biggs D., De Ville B., Suen E. (1991). A method of choosing multi-way partitions for classification and decision trees. J. Appl. Stat. 18, 49–62 10.1080/02664769100000005 - DOI
-
- Blood A. J., Iosifescu D. V., Makris N., Perlis R. H., Kennedy D. N., Dougherty D. D., et al. (2010). Phenotype genotype project on addiction and mood disorders. Microstructural abnormalities in subcortical reward circuitry of subjects with major depressive disorder. PLoS ONE 5:e13945 10.1371/journal.pone.0013945 - DOI - PMC - PubMed
-
- Brage D., Meredith W., Woodward J. (1993). Correlates of loneliness among midwestern adolescents. Adolescence 28, 685–693 - PubMed
-
- Breiman L., Friedman J. H., Olshen R. A., Stone C. J. (1984). Classification and Regression Trees. The Wadsworth statistics/probability series. New York, NY: Chapman and Hall/CRC
LinkOut - more resources
Full Text Sources
Other Literature Sources