. 2014 Sep 25:5:329.
doi: 10.3389/fgene.2014.00329. eCollection 2014.

A comparison of control samples for ChIP-seq of histone modifications

Affiliations

A comparison of control samples for ChIP-seq of histone modifications

Christoffer Flensburg et al. Front Genet. .

Abstract

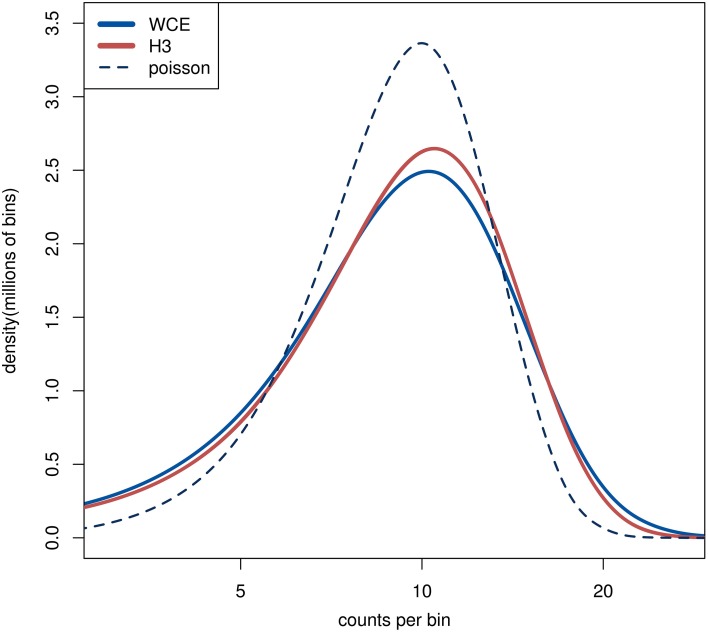
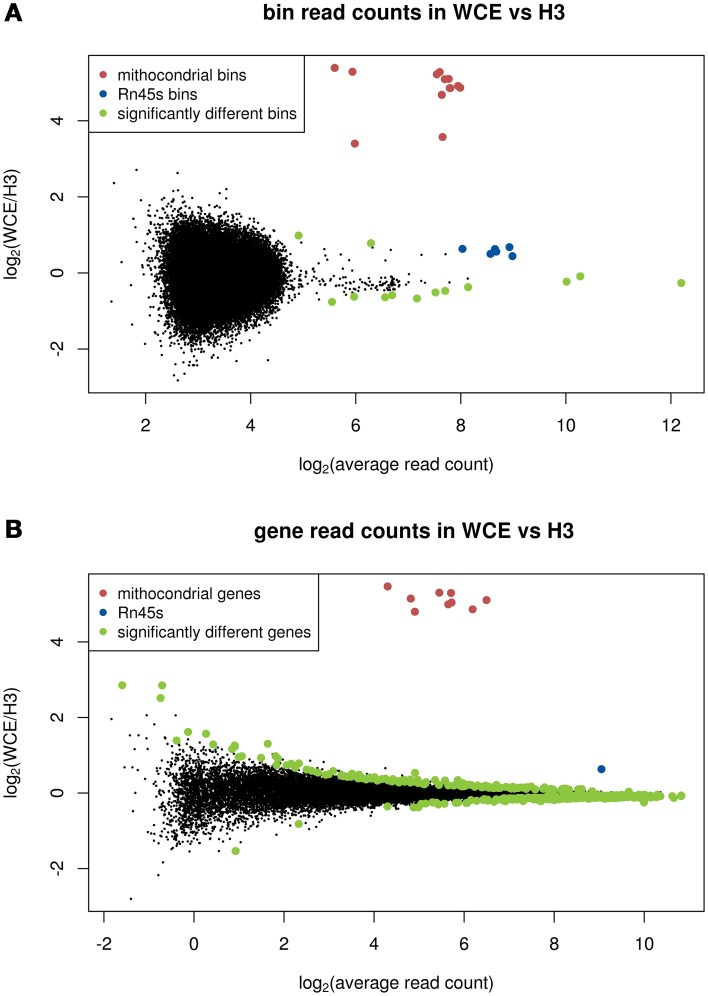
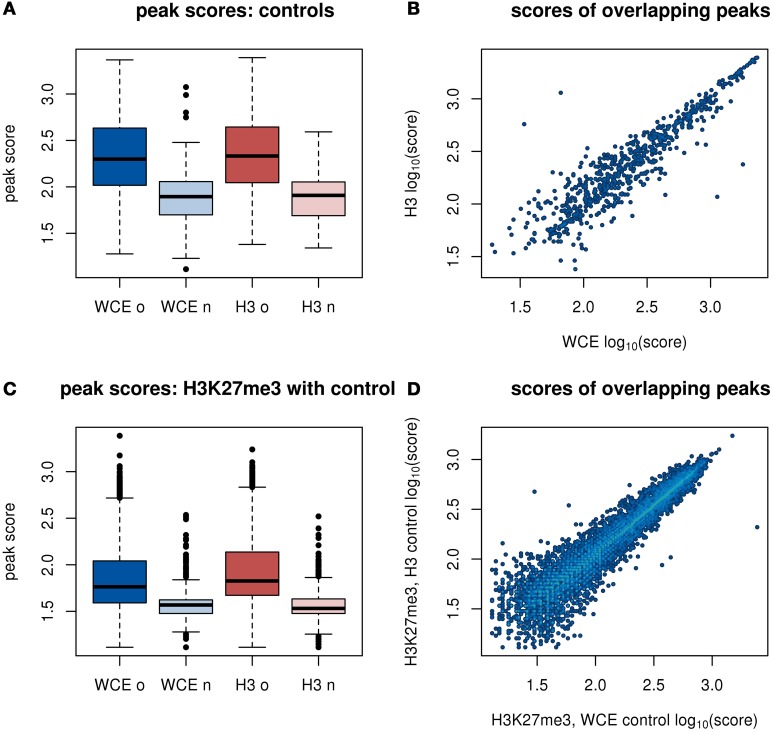
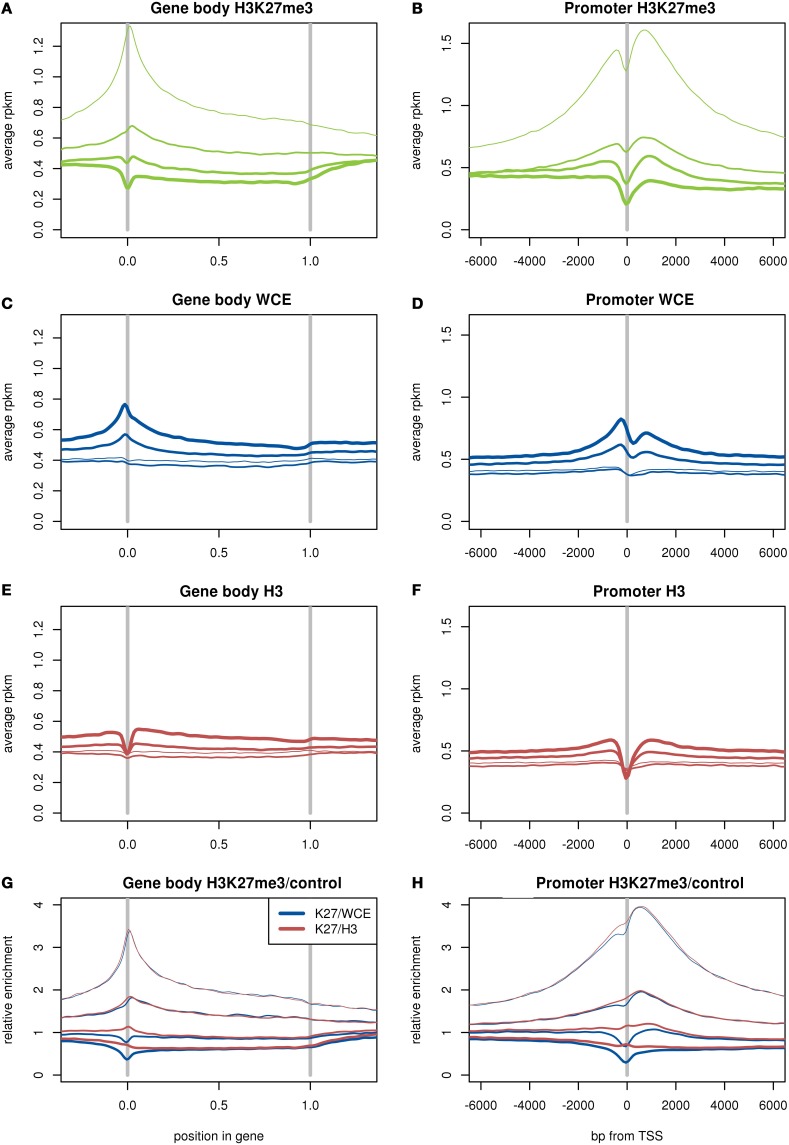
The advent of high-throughput sequencing has allowed genome wide profiling of histone modifications by Chromatin ImmunoPrecipitation (ChIP) followed by sequencing (ChIP-seq). In this assay the histone mark of interest is enriched through a chromatin pull-down assay using an antibody for the mark. Due to imperfect antibodies and other factors, many of the sequenced fragments do not originate from the histone mark of interest, and are referred to as background reads. Background reads are not uniformly distributed and therefore control samples are usually used to estimate the background distribution at any given genomic position. The Encyclopedia of DNA Elements (ENCODE) Consortium guidelines suggest sequencing a whole cell extract (WCE, or "input") sample, or a mock ChIP reaction such as an IgG control, as a background sample. However, for a histone modification ChIP-seq investigation it is also possible to use a Histone H3 (H3) pull-down to map the underlying distribution of histones. In this paper we generated data from a hematopoietic stem and progenitor cell population isolated from mouse fetal liver to compare WCE and H3 ChIP-seq as control samples. The quality of the control samples is estimated by a comparison to pull-downs of histone modifications and to expression data. We find minor differences between WCE and H3 ChIP-seq, such as coverage in mitochondria and behavior close to transcription start sites. Where the two controls differ, the H3 pull-down is generally more similar to the ChIP-seq of histone modifications. However, the differences between H3 and WCE have a negligible impact on the quality of a standard analysis.

Keywords: ChIP-seq; H3; control sample; histone modifications; input; quality control; whole cell extract.


Figures

Figure 1
Figure 1
The distribution of read counts in 1 kb bins over the genome. The lines from the two H3 samples are completely overlapping. The dashed line is from a random sample where the reads are distributed independently with equal probability for each bin. The curves are smoothly interpolated between the discrete data points.
Figure 2
Figure 2
MA plots comparing enrichment between WCE and H3: (A) 1 kb bins across the genome, (B) bins that span genes. Significantly different bin counts between samples are highlighted and Rn45s and mitochondrial bins (all significantly different) are highlighted in blue and red, respectively. Significance is defined as FDR below 0.05 in a limma-voom analysis.
Figure 3
Figure 3
Peak scores from a MACS analysis of enriched regions. H3 and H3K27me3 replicates are merged before analysis. (A) Distributions of scores of peaks in WCE and H3. The peaks in each control are split into peaks that overlap between the two background samples (marked with “o”) or do not overlap (marked with “n”). (B) Scatter plot of scores of overlapping peaks from the WCE and H3 sample. (C) Distributions of scores of peaks in H3K27me3 with either WCE or H3 as a control. Labels on the x-axis refer to the control sample. (D) Scatter plot of scores of overlapping peaks from H3K27me3 with either WCE or H3 as control.
Figure 4
Figure 4
Average read density in RPKM over genes (A,C,E) and around the transcription start site (B,D,F) for H3K27me3 (A,B), WCE (C,D), and H3 (E,F). Ratio of average read densities of H3K27me3 to the background sample over genes (G) and around the TSS (H). The genes are divided up into four equal groups based on expression (RPKM), shown by thin lines for lowest expression and thicker lines for higher expression. The two H3 samples and three H3K27me3 samples are merged.

References

    1. Adli M., Zhu J., Bernstein B. E. (2010). Genome-wide chromatin maps derived from limited numbers of hematopoietic progenitors. Nat. Methods 7, 615–618 10.1038/nmeth.1478 - DOI - PMC - PubMed
    1. Bernstein B. E., Stamatoyannopoulos J. A., Costello J. F., Ren B., Milosavljevic A., Meissner A., et al. (2010). The NIH roadmap epigenomics mapping consortium. Nat. Biotechnol. 28, 1045–1048 10.1038/nbt1010-1045 - DOI - PMC - PubMed
    1. Bock I., Dhayalan A., Kudithipudi S., Brandt O., Rathert P., Jeltsch A. (2011). Detailed specificity analysis of antibodies binding to modified histone tails with peptide arrays. Epigenetics 6, 256–263 10.4161/epi.6.2.13837 - DOI - PMC - PubMed
    1. Chen X. J., Butow R. A. (2005). The organization and inheritance of the mitochondrial genome. Nat. Rev. Genet. 6, 815–825 10.1038/nrg1708 - DOI - PubMed
    1. Consortium, Encode Project. (2004). The ENCODE (ENCyclopedia Of DNA Elements) Project. Science 306, 636–640 10.1126/science.1105136 - DOI - PubMed

LinkOut - more resources