. 2014 May;4(3):225-248.
doi: 10.1002/wcms.1169.

The power of coarse graining in biomolecular simulations

Affiliations
Free PMC article

The power of coarse graining in biomolecular simulations

Helgi I Ingólfsson et al. Wiley Interdiscip Rev Comput Mol Sci. 2014 May.
Free PMC article

Abstract

Computational modeling of biological systems is challenging because of the multitude of spatial and temporal scales involved. Replacing atomistic detail with lower resolution, coarse grained (CG), beads has opened the way to simulate large-scale biomolecular processes on time scales inaccessible to all-atom models. We provide an overview of some of the more popular CG models used in biomolecular applications to date, focusing on models that retain chemical specificity. A few state-of-the-art examples of protein folding, membrane protein gating and self-assembly, DNA hybridization, and modeling of carbohydrate fibers are used to illustrate the power and diversity of current CG modeling.


Figures
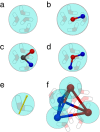
FIGURE 1
FIGURE 1
Mapping strategies for CG water models: (a) regular Martini water, (b) GROMOS CG water, (c) Martini compatible polarizable water (PW), (d) big multipole water (BMW), (e) ELBA induced point dipole water, and (f) Wat Four (WT4).
FIGURE 2
FIGURE 2
Mapping strategies for CG lipid models illustrated for a dimyristoylphosphatidylcholine (DMPC) lipid. (a) Shelley et al. and (b) Martini,, models are overlaid on the atomistic structure. (c) The one bead per lipid aggressively CG model of Ayton and Voth showing the analytical Gay-Berne ellipsoid particle model combined with an in-plane potential systematically derived from atomistic simulations.
FIGURE 3
FIGURE 3
Mapping strategies for CG protein models illustrated for an AlaArgPheAla peptide. (a) In the model from Bereau and Deserno, the CG particle for the side chain is located on Cβ but the effective vdW radius is for the entire side chain. (b) In the OPEP, model the backbone H-atom are represented explicitly. (c) In the Martini model the backbone bead is at the center of mass of the non-H atoms and its type is secondary structure specific. (d) In the UNRES model the Cα is a virtual site, the interaction sites are the peptide-bond and the side chain ellipsoids.
FIGURE 4
FIGURE 4
Mapping strategies for CG nucleotide models illustrated for cytosine (top) and guanine (bottom) based on (a) 3SPN.0, (b) Ouldridge, and (c) Dans models.
FIGURE 5
FIGURE 5
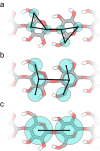
Mapping strategies for CG carbohydrate models illustrated for a single cellulose fibril. (a) The MB3 model is based on the atomistic position of C1, C4, and C6 for every hexopyranose. (b) The Martini model relies on the COM of the atoms enclosed by the circles. (c) The solvent-free model of Srinivas et al. makes use of a single bead for the representation of every monosaccharide subunit.
FIGURE 6
FIGURE 6
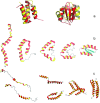
CG protein folding. (a) Predicted structures from the UNRES CG FF in CASP6 exercise for targets T0215 (left) and T0281 (right). The native structure is colored red and the predicted structure yellow. (b) Snapshots from an ab initio folding of a 48-residue Lysm domain protein and (c) a synthetic domain-swapped protein consisting of two 48-residue chains. Figure 6b reproduced with permission from Ref . Copyright 2005, PNAS. Figure 6c reproduced with permission from Ref . Copyright 2007, American Chemical Society.
FIGURE 7
FIGURE 7
Reversible gating of MscL using the Martini CG model. A MscL is solvated in a DOPC bilayer and equilibrated for 4 μs (left). Surface tension is then applied to the bilayer, the channel opens and CG water permeates through the large channel opening (middle). When surface tension is removed the channel recloses and water flux is almost completely abolished (right).
FIGURE 8
FIGURE 8
Membrane protein self-assembly. Snapshot of 64 visual receptor rhodopsins in a DOPC bilayer. The receptors were initially placed on a 8 × 8 grid and left free to self-assemble for a period of 100 μs. The receptor's transmembrane helices are shown as orange tube and the backbone trace in brown. The lipid head groups are shown in light blue, the glycerol moieties in white, and the tails in gray.
FIGURE 9
FIGURE 9
DNA hybridization process. Starting with two separate strands, they first associate and form a nucleation site. Bases make complementary pairs leading to a fully hybridized dsDNA. The data for the figures are produced with the recent 3SPN.2 model. Figure kindly provided by Dan Hinckley and Juan de Pablo.
FIGURE 10
FIGURE 10
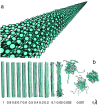
Cellulose microfibril. (a) Representation of the crystalline Iβ cellulose microfibril according to Srinivas et al. model. (b) Transition of cellulose from its crystalline state to the amorphous conformation. The structural change is dependent on the tuneable LJ coupling factor λ. Reproduced with permission from Ref . Copyright 2011, American Chemical Society.

References

    1. Lee EH, Hsin J, Sotomayor M, Comellas G, Schulten K. Discovery through the computational microscope. Structure. 2009;17:1295–1306. - PMC - PubMed
    1. Dror RO, Dirks RM, Grossman JP, Xu H, Shaw DE. Biomolecular simulation: a computational microscope for molecular biology. Annu Rev Biophys. 2012;41:429–452. - PubMed
    1. Voth GA. Coarse-Graining of Condensed Phase and Biomolecular Systems. Boca Raton, FL: CRC Press, Taylor and Francis; 2009.
    1. Bond PJ, Holyoake J, Ivetac A, Khalid S, Sansom MSP. Coarse-grained molecular dynamics simulations of membrane proteins and peptides. J Struct Biol. 2007;157:593–605. - PubMed
    1. Lyubartsev AP, Laaksonen A. Calculation of effective interaction potentials from radial distribution functions: a reverse Monte Carlo approach. Phys Rev E. 1995;52:3730. - PubMed

LinkOut - more resources