. 2013 Aug 1;3(4):486-493.
doi: 10.1166/jbt.2013.1103.

A sulfated nanofibrous mesh supporting the osteogenic differentiation of periosteum-derived cells

Affiliations

A sulfated nanofibrous mesh supporting the osteogenic differentiation of periosteum-derived cells

Tera M Filion et al. J Biomater Tissue Eng. .

Abstract

The periosteum is a thin fibrous membrane covering the surface of long bone and is known to play a critical role in bone development and adult bone fracture healing. Loss or damage of the periosteum tissue during traumatic long bone injuries can lead to retarded healing of bone graft-mediated repair. The regenerative potential of periosteum-derived progenitor cells (PDCs) has inspired their use as an alternative to bone marrow-derived mesenchymal stromal cells (MSCs) to augment scaffold-assisted bone repair. In this study, we first demonstrated that PDCs isolated from adult rat long bone exhibited innate advantages over bone marrow-derived MSCs in terms of faster proliferation and more potent osteogenic differentiation upon induction in plastic-adherent culture. Further, we examined the potential of two electrospun nanofibrous meshes, an uncharged regenerated cellulose mesh and a sulfated mesh, to support the attachment and osteogenic differentiation of PDCs. We showed that both nanofibrous meshes were able to support the attachment and proliferation of PDCs and MSCs alike, with the sulfated mesh enabling significantly higher seeding efficiency than the cellulose mesh. Both meshes were also able to support the osteogenic differentiation of adherent PDCs upon induction by osteogenic media, with the sulfated mesh facilitating more potent mineral deposition by adherent PDCs. Our study supports the sulfated nanofibrous mesh as a promising synthetic periosteal membrane for the delivery of exogenous PDCs to augment bone healing.


Figures
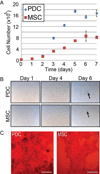
Figure 1
Figure 1. Proliferation and osteogenic differentiation of PDCs and MSCs on tissue culture plastics
(A) Growth curves over 7 days in expansion media; Error bars: standard deviation of the mean (n=3). (B) β-Galactosidase staining of cultures in expansion media (5x objective), with arrows indicating β-Galactosidase positive (blue) cells. (C) Alizarin red staining 21 days after osteogenic induction; Scale bars: 100 µm.
Figure 2
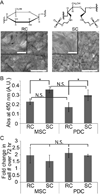
Figure 2. Attachment and proliferation of PDCs and MSCs on RC and SC meshes
(A) Chemical structures of RC and SC and corresponding SEM micrographs of the meshes. Scale bars: 10 µm for higher resolution insets; 40 µm for lower resolution micrographs. (B) Seeding efficiencies of PDCs and MSCs at day 1 on RC or SC mesh as determined by CCK-8 assay (n=3). (C) Proliferation rate of MSCs and PDCs on RC or SC mesh as determined by fold of change in cellular activity over 72 h (from day 1 to day 4 after initial cell seeding) by CCK-8 assay (n=3). Error bars: standard deviation of the mean. *p<0.05, NS: not significant (student’s t test).
Figure 3
Figure 3. Alizarin red and alkaline phosphatase (ALP) staining of PDCs on RC and SC meshes upon osteogenic induction
(A) Macroscopic images of alizarin red stained RC and SC meshes with and without seeded PDCs 1 and 2 weeks after osteogenic induction; Scale bar: 6.8 mm. No cell mesh controls revealed minimal non-specific absorption of alizarin red dye on the meshes. (B) Top: Micrographs of the alizarin red stained meshes 2 weeks after osteogenic induction (zoomed-in over the squared regions shown in (A), scale bars: 100 µm); Bottom: quantification of alizarin red staining 2 weeks after osteogenic induction; Error bars: standard deviation of the mean (n=3); *p<0.05 (student’s t test). (C) Micrographs of ALP-stained RC and SC meshes with seeded PDCs 1 and 2 weeks after osteogenic induction, with arrows indicating ALP positive (red) cells at 1 week; scale bars: 100 µm.
Figure 4
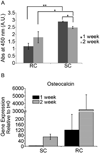
Figure 4. Cellular proliferation and osteocalcin gene expression of PDCs on RC and SC meshes upon osteogenic induction
(A) PDC proliferation on RC and SC meshes from 1 to 2 weeks upon osteogenic induction as determined by CCK-8 assay (n=3). (B) Osteocalcin gene expression of PDCs on RC and SC meshes at 1 and 2 weeks upon osteogenic induction relative to time 0. Data are normalized with housekeeping gene GAPDH and plotted as expression relative to that prior to seeding onto the meshes (time 0). Error bars: standard deviation of the mean. *p<0.05; **p<0.001 (student’s t test).

References

    1. Bonzani IC, George JH, Stevens MM. Curr Opin Chem Biol. 2006;10:568. - PubMed
    1. Michal Crha AN, Srnec Robert, Janovec Jan, Stehlik Ladislav, Rauser Petr, Urbanova Lucie, Planka Ladislav, jancar Josef, Amler Evzen. Acta Vet. BRNO. 2009;78:635.
    1. Mauney JR, Volloch V, Kaplan DL. Tissue Eng. 2005;11:787. - PubMed
    1. Lutolf MP, Hubbell JA. Nat Biotechnol. 2005;23:47. - PubMed
    1. Fisher OZ, Khademhosseini A, Langer R, Peppas NA. Acc Chem Res. 2010;43:419. - PMC - PubMed

LinkOut - more resources