. 2014 Oct 13;9(10):e109082.
doi: 10.1371/journal.pone.0109082. eCollection 2014.

Cytoskeletal dependence of insulin granule movement dynamics in INS-1 beta-cells in response to glucose

Affiliations

Cytoskeletal dependence of insulin granule movement dynamics in INS-1 beta-cells in response to glucose

Aoife T Heaslip et al. PLoS One. .

Abstract

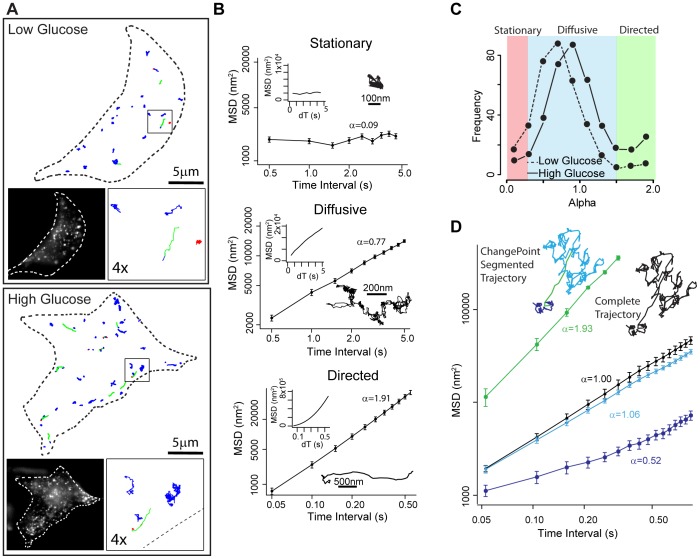
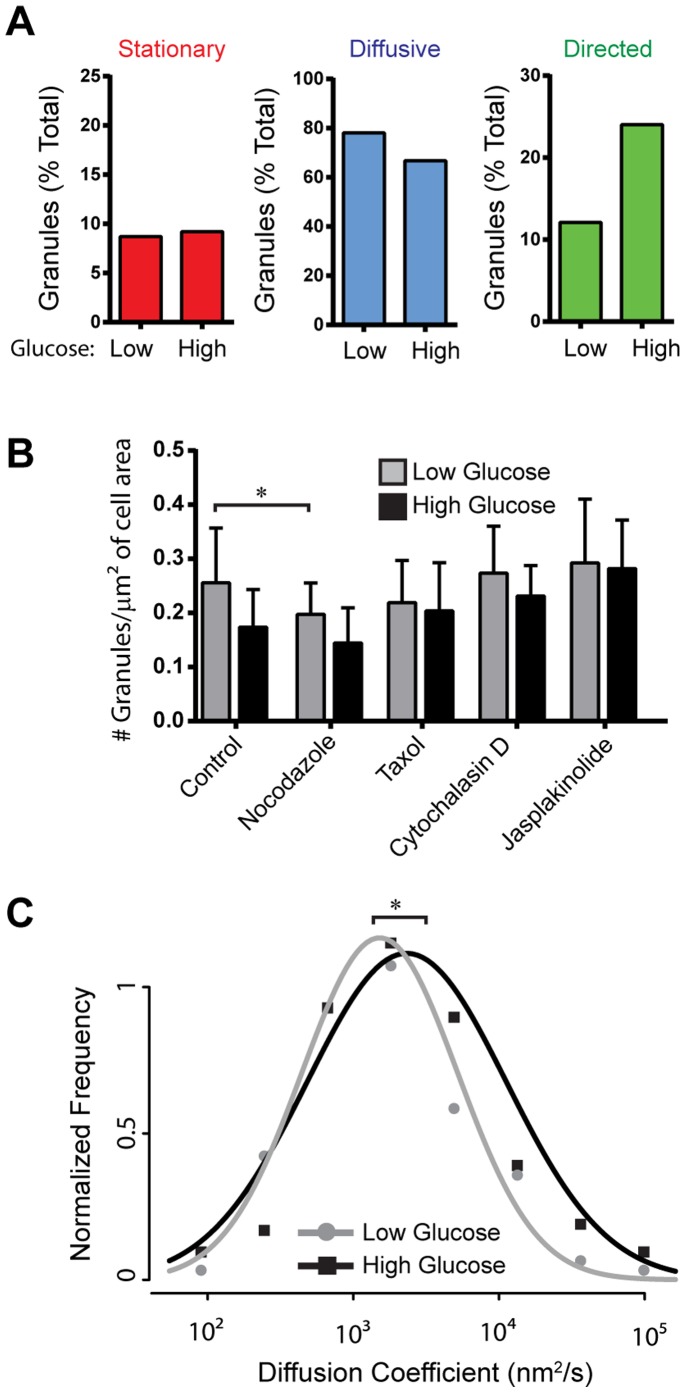
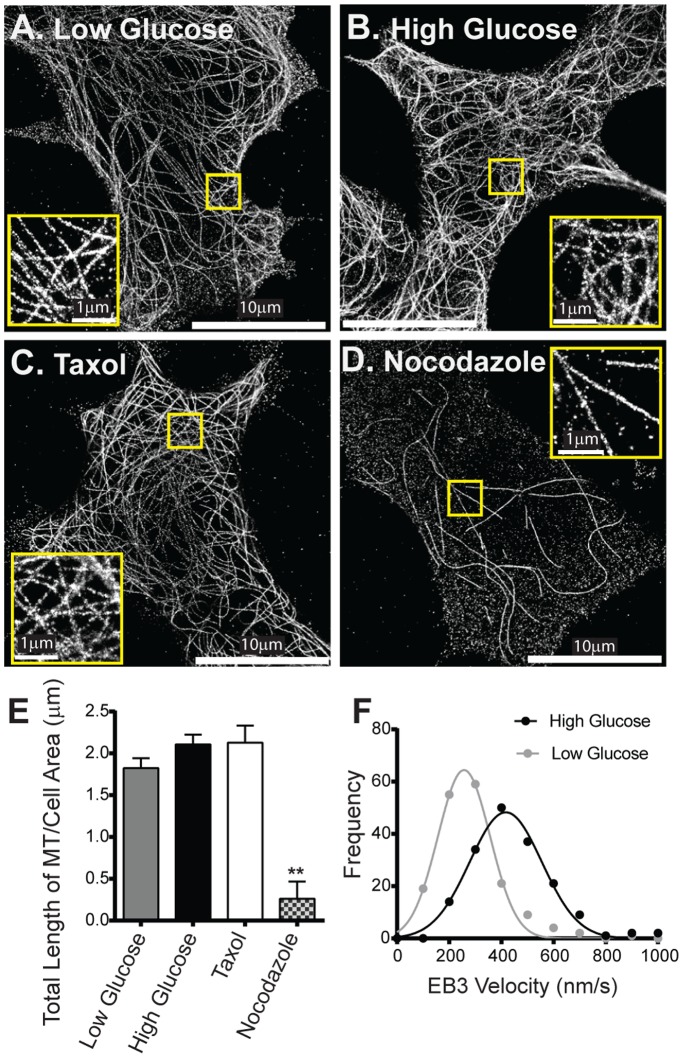
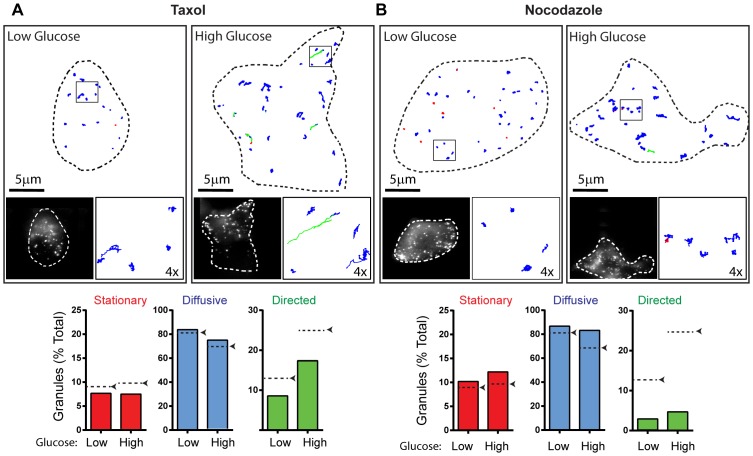
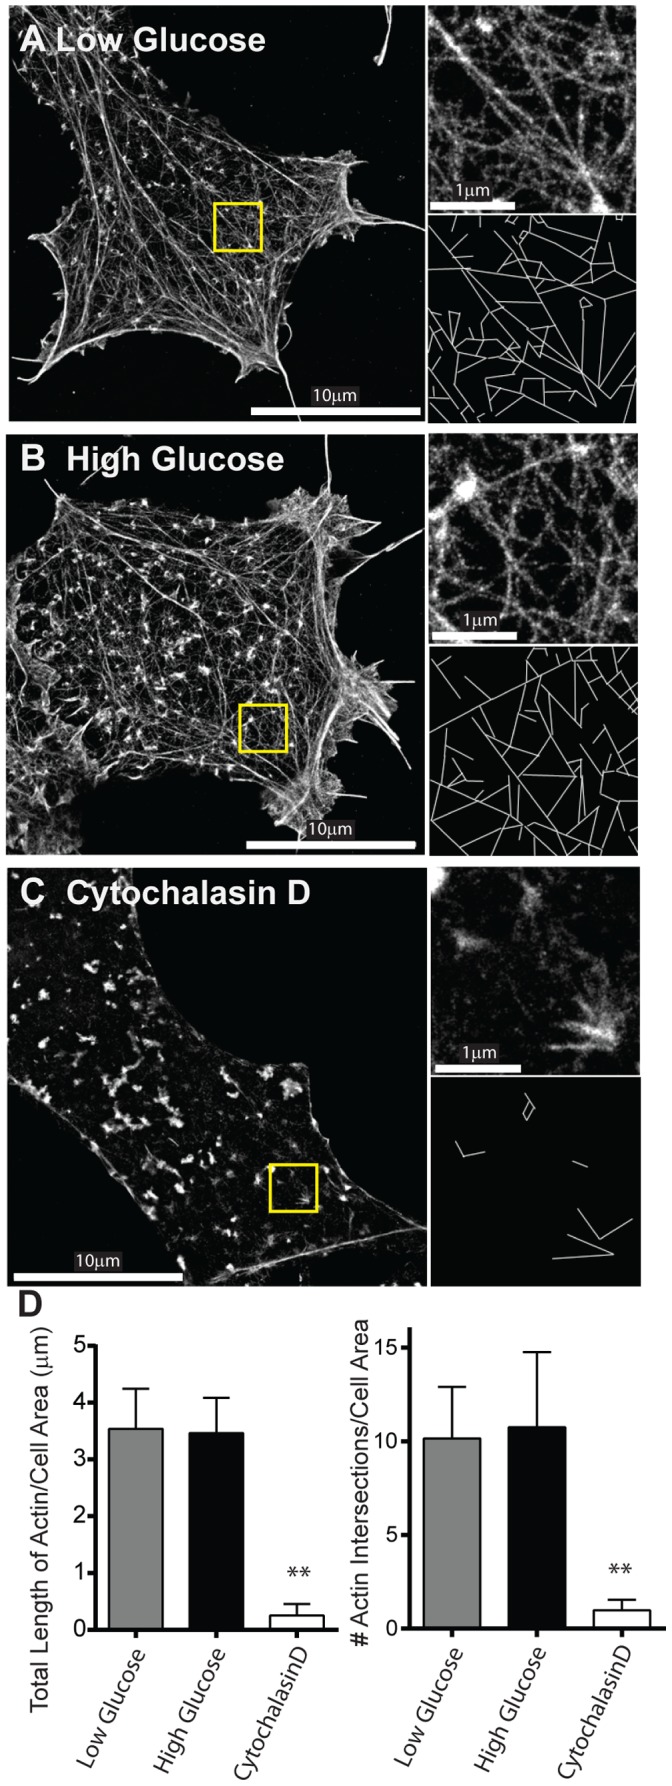
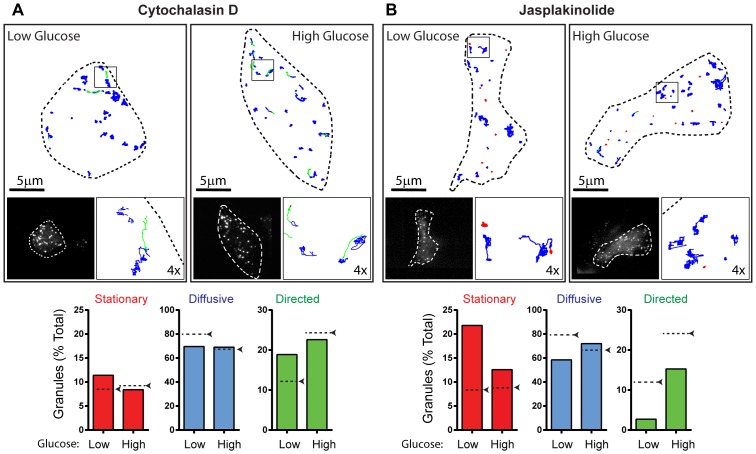
For pancreatic β-cells to secrete insulin in response to elevated blood glucose, insulin granules retained within the subplasmalemmal space must be transported to sites of secretion on the plasma membrane. Using a combination of super-resolution STORM imaging and live cell TIRF microscopy we investigate how the organization and dynamics of the actin and microtubule cytoskeletons in INS-1 β-cells contribute to this process. GFP-labeled insulin granules display 3 different modes of motion (stationary, diffusive-like, and directed). Diffusive-like motion dominates in basal, low glucose conditions. Upon glucose stimulation no gross rearrangement of the actin cytoskeleton is observed but there are increases in the 1) rate of microtubule polymerization; 2) rate of diffusive-like motion; and 3) proportion of granules undergoing microtubule-based directed motion. By pharmacologically perturbing the actin and microtubule cytoskeletons, we determine that microtubule-dependent granule transport occurs within the subplasmalemmal space and that the actin cytoskeleton limits this transport in basal conditions, when insulin secretion needs to be inhibited.


Conflict of interest statement

Competing Interests: The authors have declared that no competing interests exist.

Figures

Figure 1
Figure 1. Modes of motion of GFP-labeled insulin granules.
(A) Outline of representative INS-1 cells with insulin granule trajectories overlaid in low (upper panel) and high (lower panel) glucose conditions. Left inset: image of INS-1 cell with eGFP-labeled insulin granules. Right inset: 4× magnification of trajectories in the black box. Trajectories are color-coded to depict mode of granule motion. Red indicates stationary granule, blue indicates diffusive-like motion, and green indicates directed motion. (B) Insulin granules display 3 distinct modes of motion: stationary, diffusive-like and directed. Example trajectories for each mode of motion and MSD plots on log-log axes (large graphs) and linear axes (inset; dT equals time interval) are shown. Diffusive exponent, α, which is the slope of the log-log MSD indicated. (C) Frequency distribution of α values in low (dashed line: 383 granules in 14 cells) and high (solid line: 457 granules in 15 cells) glucose conditions. α<0.25 characterizes granules as stationary (red shaded area), 0.25≤α≤1.5 as undergoing random motion (diffusive-like, blue shaded area) and α>1.5 as undergoing directed motion (green shaded area). (D) Log-log MSD plots and trajectory of a granule that switches modes of motion during a trajectory. When MSD analysis is performed on the entire trajectory, α = 1 (black line, black trajectory). After analysis using the ChangePoint algorithm, 3 periods of motion are identified: diffusive-like (α = 0.53, dark blue line), directed (α = 1.93, green line) and diffusive-like (α = 1.06, light blue line). Error bars indicate standard error.
Figure 2
Figure 2. Effect of glucose stimulation on insulin granule motion.
(A) Bar charts depict the percentage of granules that exhibit stationary, diffusive-like, and directed motions in low and high glucose conditions. 14 cells/383 granules in low glucose and 15 cells/457 granules in high glucose conditions were analyzed. (B) Effect of glucose stimulation on granule number at the subplasmalemmal space within the TIRF field. Glucose stimulation causes a significant decrease in granule number at the cell surface in control and drug treated cells as determined using a two-way ANOVA F(1, 148) = 8.81, p = 0.0035. In low glucose conditions nocodazole treatment results in a significant decrease in number of granules at the cell surface (p<0.05). Error bars indicate standard deviation. Number of cells analyzed in low and high glucose conditions, respectively, are as follows: control 15/16; nocodazole 21/24; taxol 19/20; cytochalasin D 13/15; jasplakinolide 6/7. (C) Normalized diffusion coefficient frequency distributions show that high glucose stimulation significantly increases of granule diffusion coefficients compared to basal, low glucose conditions (p<0.01).
Figure 3
Figure 3. Effect of glucose stimulation on microtubule structure and dynamics.
Super-resolution STORM images of microtubules in INS-1 cells in low (A) and high (B) glucose conditions, and after perturbation of the microtubule cytoskeleton with taxol (C) and nocodazole (D). Insets in A–D show 3× magnification of area in the yellow box. (E) Total microtubule (MT) length per µm2 of imaged cell area under various conditions. ** indicates p<0.001. (F) Frequency distribution of EB3 velocities show that glucose stimulation (black line: n = 170 from 6 cells) causes a significant (p<0.001) increase in microtubule polymerization velocities compared to low glucose conditions (grey line: n = 173 from 6 cells).
Figure 4
Figure 4. Effect of microtubule perturbation on insulin granule dynamics.
(A and B: Upper Image Panels) Outline of a representative INS-1 cells with insulin granule trajectories overlaid in low and high glucose conditions after treatment with taxol (A) and nocodazole (B). Left inset: image of INS-1 cells with eGFP-labeled insulin granules. Right inset: 4× magnification of trajectories in the black box. Trajectories are color-coded to depict mode of granule motion. Red indicates stationary granule, blue indicates diffusive-like motion, and green indicates directed motion. (A and B: Lower Panel) Bar charts depict the percentage of granules exhibiting stationary, diffusive-like, and directed motions in low and high glucose conditions. Black arrows/dashed lines indicate the percentage of granules in each population in control cells from Figure 2A. Taxol: 17 cells/282 granules in low glucose and 15 cells/289 granules in high glucose conditions were analyzed. Nocodazole: 18 cells/321 granules in low glucose and 23 cells/428 granules in high glucose conditions were analyzed.
Figure 5
Figure 5. Effect of glucose stimulation on actin filament organization.
Super-resolution STORM images of the actin cytoskeleton in INS-1 cells in low (A) and high (B) glucose conditions and after actin depolymerization with cytochalasin D (C). In each STORM image (A–C) yellow highlighted area is magnified 3x in the upper right image with skeletonized image below used for quantification of actin filament length and number of actin filament intersections in D. (D) Quantification of actin organization. Left: The length of actin per µm2 of imaged cell area under various conditions. Right: The number of actin intersections per µm2 of imaged cell area under various conditions. ** indicates p<0.001. Values are mean±SEM.
Figure 6
Figure 6. Effect of actin filament perturbation on insulin granule dynamics.
(A and B: Upper Image Panels) Outline of a representative INS-1 cells with insulin granule trajectories overlaid in low and high glucose conditions after treatment with cytochalasin D (A) and jasplakinolide (B). Left inset: image of INS-1 cells with eGFP-labeled insulin granules. Right inset: 4× magnification of trajectories in the black box. Trajectories are color-coded to depict mode of granule motion. Red indicates stationary granule, blue indicates diffusive-like motion, and green indicates directed motion. (A and B: Lower Panel) Bar charts depict the percentage of granules exhibiting stationary, diffusive-like, and directed motions in low and high glucose conditions after cytochalasin D (A) and jasplakinolide treatment (B). Black arrows/dashed lines indicate the percentage of granules in each population in control cells. Cytochalasin D: 12 cells/230 granules in low glucose and 15 cells/289 granules in high glucose conditions were analyzed. Jasplakinolide: 7 cells/174 granules in low glucose and 6 cells/211 granules in high glucose conditions were analyzed.

References

    1. Del Prato S, Marchetti P, Bonadonna RC (2002) Phasic insulin release and metabolic regulation in type 2 diabetes. Diabetes 51 Suppl 1: S109–116. - PubMed
    1. Del Prato S, Tiengo A (2001) The importance of first-phase insulin secretion: implications for the therapy of type 2 diabetes mellitus. Diabetes Metab Res Rev 17: 164–174. - PubMed
    1. Gupta D, Krueger CB, Lastra G (2012) Over-nutrition, obesity and insulin resistance in the development of beta-cell dysfunction. Curr Diabetes Rev 8: 76–83. - PubMed
    1. Rorsman P, Renstrom E (2003) Insulin granule dynamics in pancreatic beta cells. Diabetologia 46: 1029–1045. - PubMed
    1. Park JJ, Loh YP (2008) How peptide hormone vesicles are transported to the secretion site for exocytosis. Mol Endocrinol 22: 2583–2595. - PMC - PubMed

Publication types