. 2015 May;13(5):1000-8.e3.
doi: 10.1016/j.cgh.2014.10.008. Epub 2014 Oct 13.

Severity of nonalcoholic fatty liver disease and progression to cirrhosis are associated with atherogenic lipoprotein profile

Affiliations

Severity of nonalcoholic fatty liver disease and progression to cirrhosis are associated with atherogenic lipoprotein profile

Mohammad S Siddiqui et al. Clin Gastroenterol Hepatol. 2015 May.

Abstract

Background & aims: Nonalcoholic fatty liver disease (NAFLD) is associated independently with increased cardiovascular mortality. Although NAFLD is associated with dyslipidemia, it is not clear whether recently identified markers of cardiovascular risk indicate liver disease progression in patients with histologically confirmed NAFLD. We evaluated an extensive panel of serum markers of cardiovascular risk in nondiabetic patients with histologically proven NAFLD.

Methods: We performed a case-control study in which we compared serum levels of laboratory markers of cardiovascular risk among 81 nondiabetic subjects with histologically confirmed NAFLD vs lean (N = 81) and obese (N = 81) individuals without NAFLD (based on liver fat score, controls). For ex vivo studies, liver tissues were obtained from subjects undergoing elective cholecystectomy or from a tissue repository.

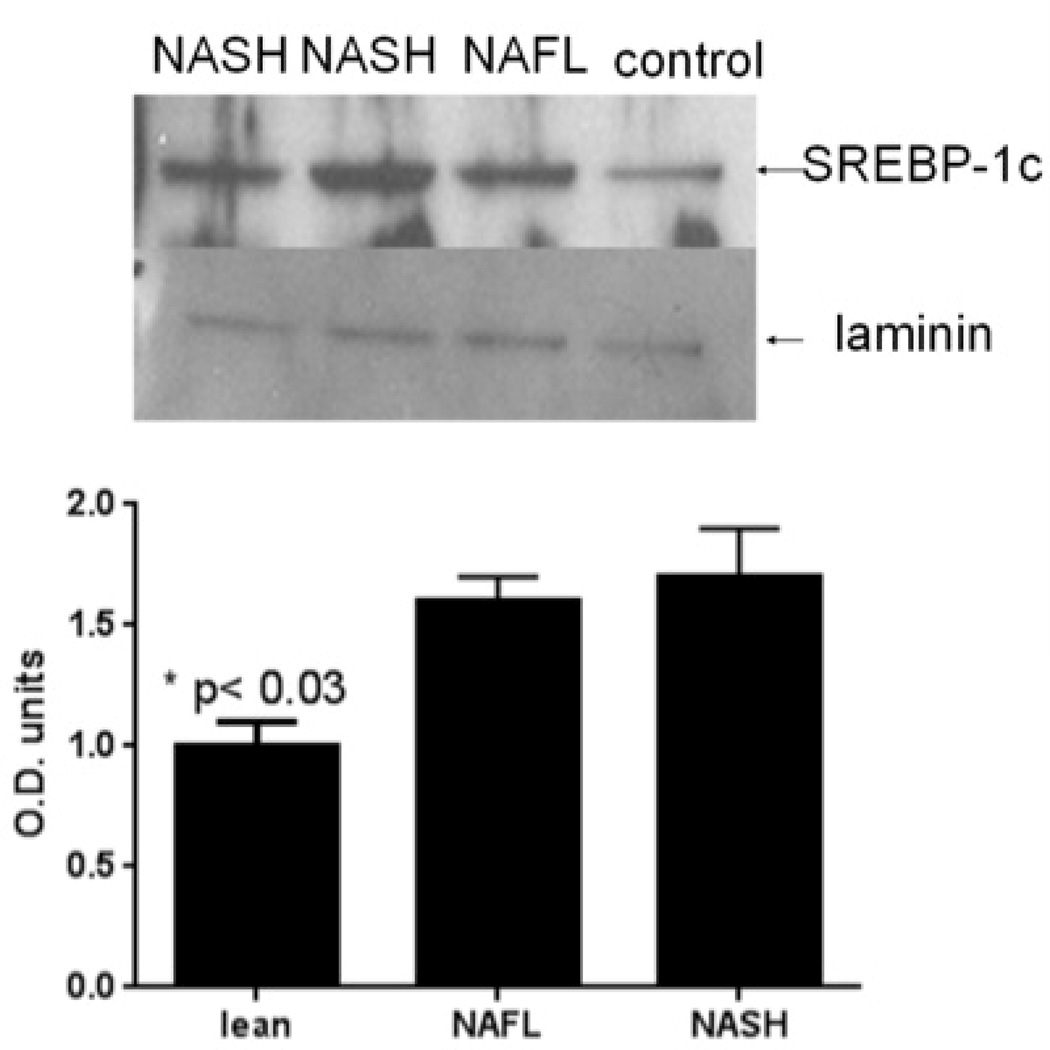
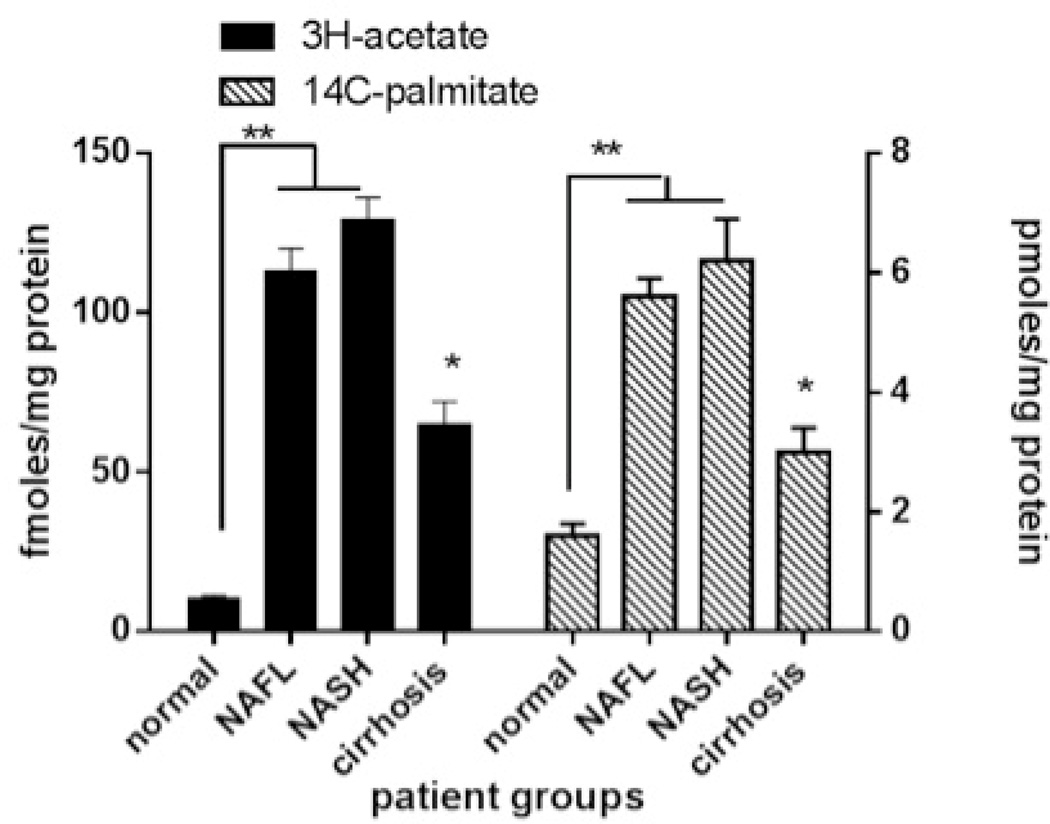
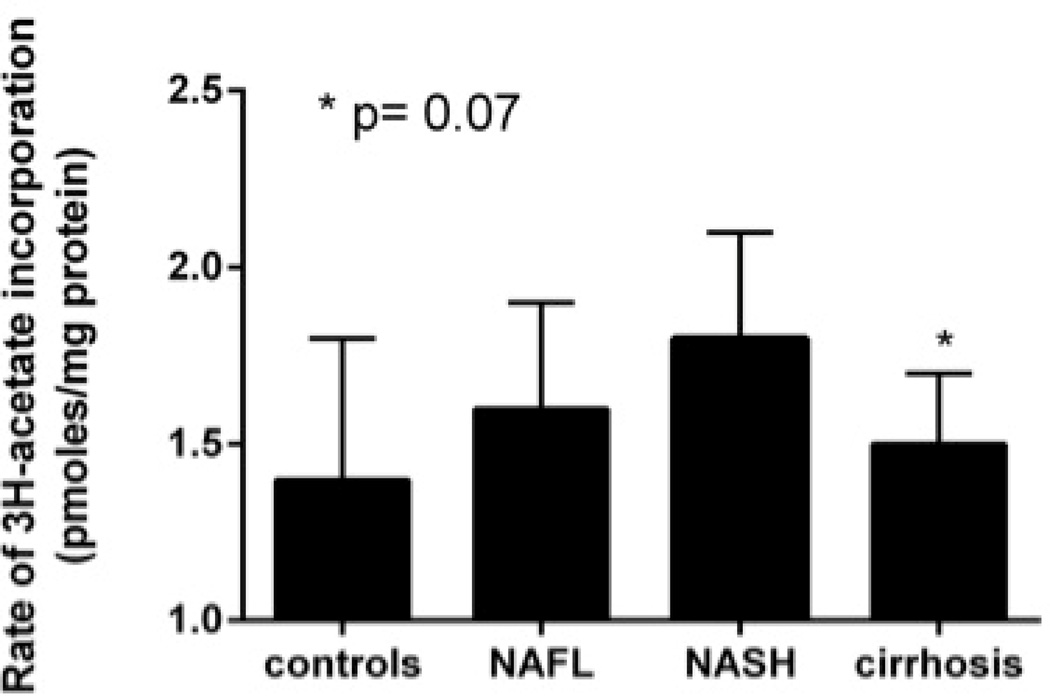
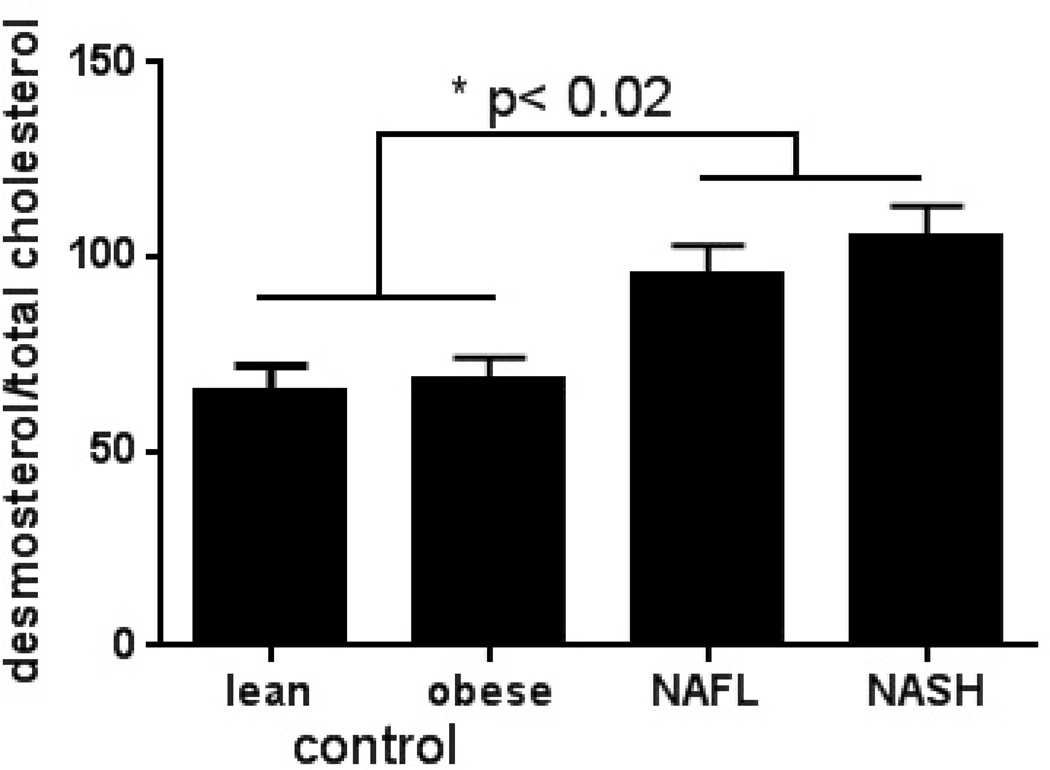
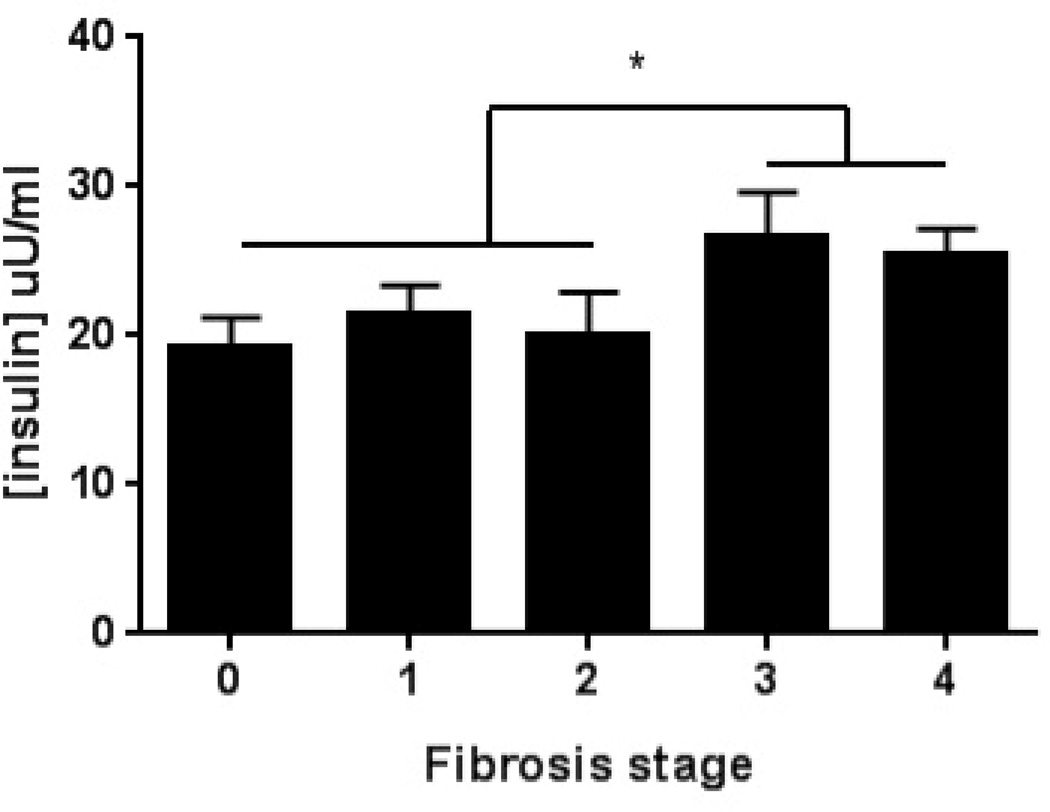
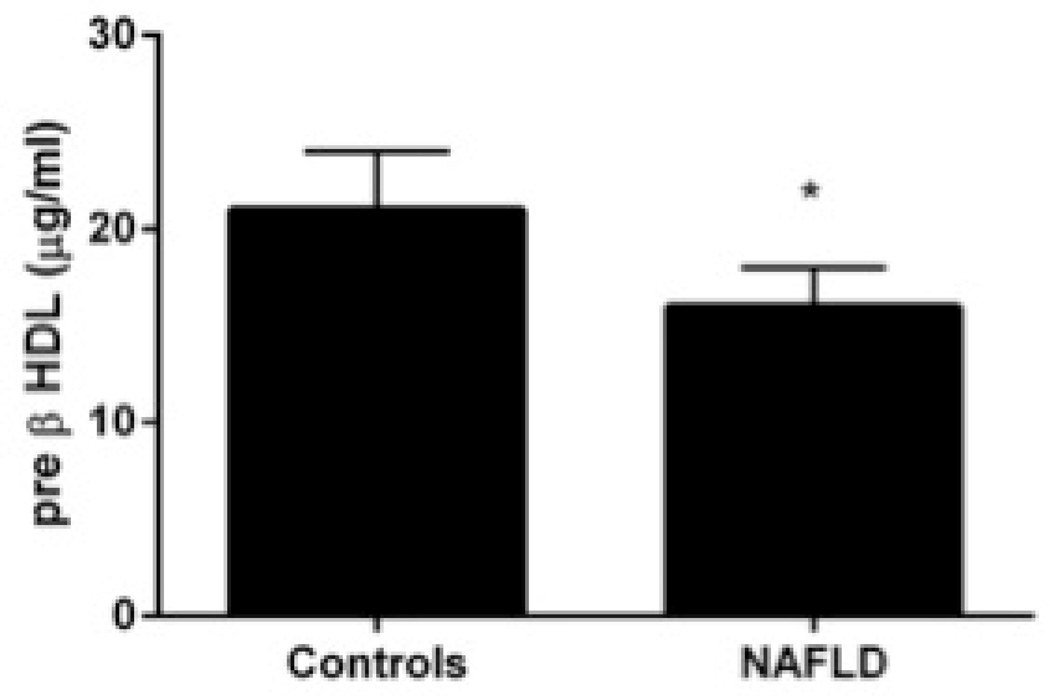
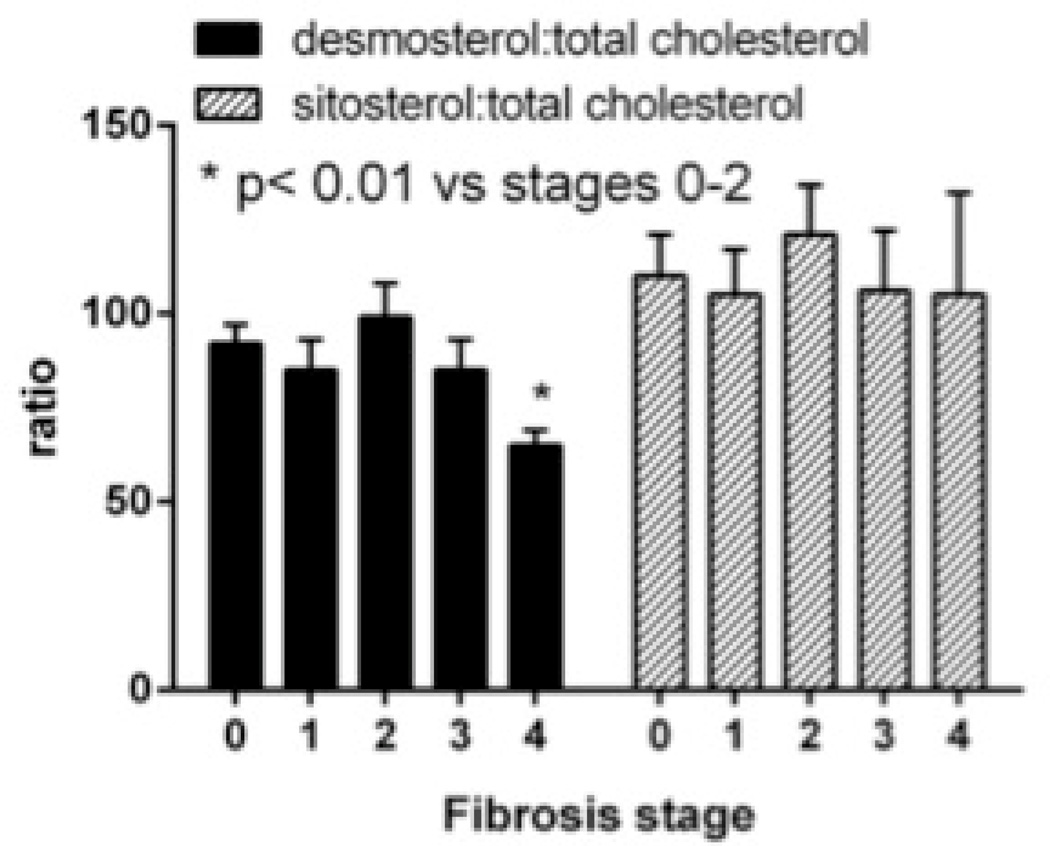
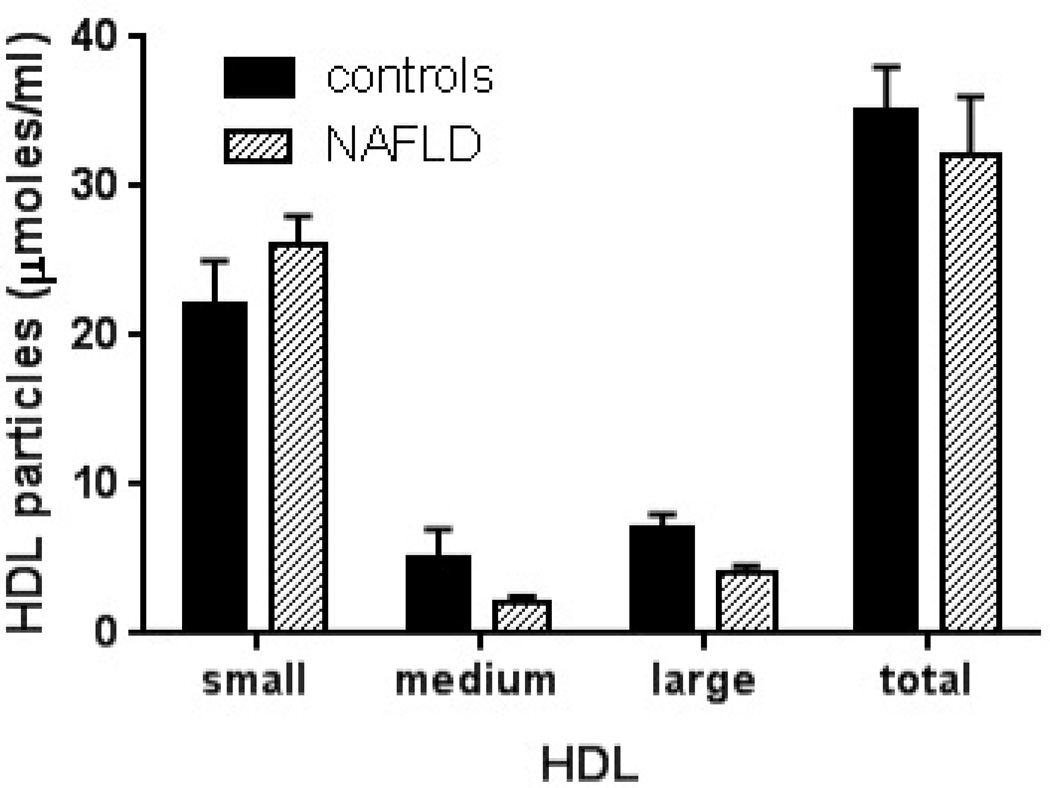
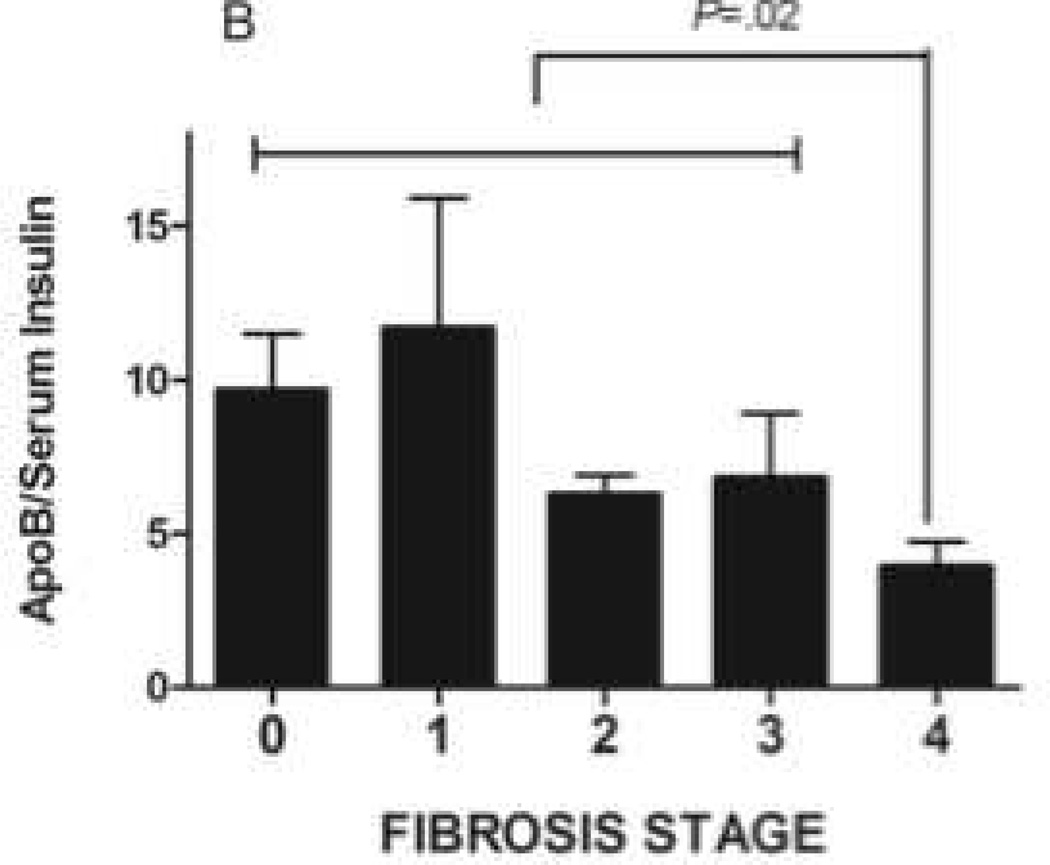
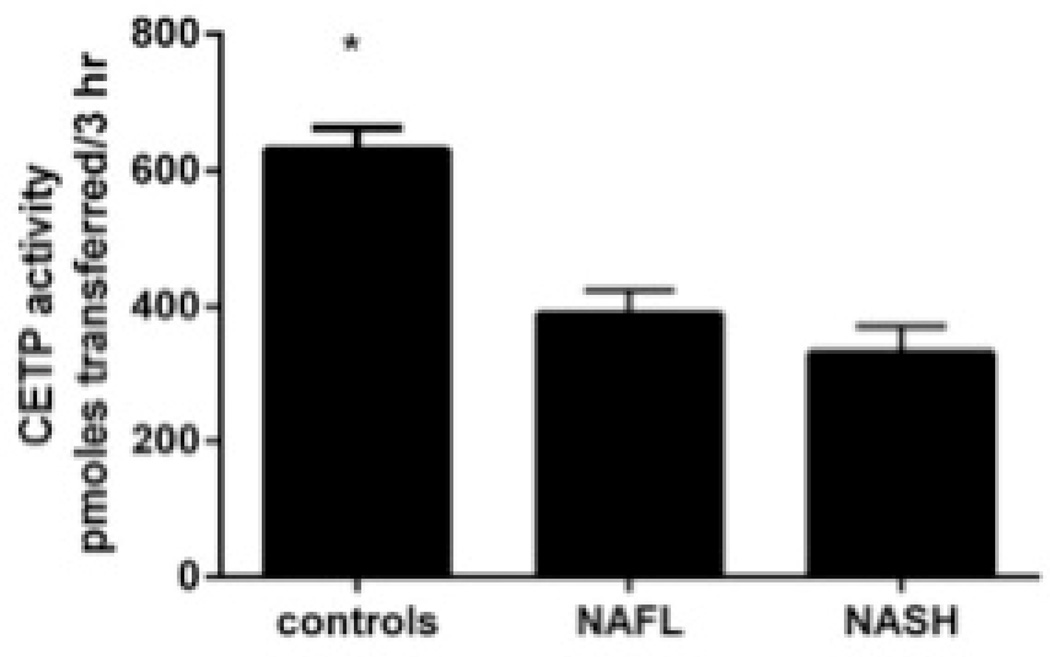
Results: Subjects with NAFLD had increased serum levels of insulin, triglycerides, and apolipoprotein B; increased size and concentration of very large density lipoprotein particles; increased concentrations of low-density lipoprotein (LDL) particles and small dense LDL (sdLDL) cholesterol, and an increased percentage of sdLDL, compared with controls. Although nonalcoholic steatohepatitis was associated with a worse profile of serum atherogenic markers than NAFLD, these differences did not reach statistical significance. Despite hyperinsulinemia, triglyceride and apolipoprotein B levels, concentrations of LDL particles and LDL cholesterol, and sdLDL-related parameters decreased significantly in patients with cirrhosis. Ex vivo studies showed that patients with NAFLD had increased sensitivity of hepatic triglyceride levels and cholesterol synthesis to insulin, and that sensitivity increased the development of cirrhosis.

Conclusions: Atherogenic dyslipidemia is related to increased insulin-induced hepatic lipid synthesis in patients with NAFLD. Reduced dyslipidemia in patients with cirrhosis is associated with increased insulin resistance and possibly failed lipid synthesis.

Keywords: Heart Disease; Metabolic Syndrome; NASH; Obesity; Steatosis.


Conflict of interest statement

Conflict of Interest: None of the authors have any conflict of interest to report except: Puneet Puri (Board Membership Health Diagnostic Laboratories)

Figures

Figure 1
Figure 1. Hyperinsulinemia and dyslipidemia in NAFLD
A. Compared to controls, patients with NAFLD and NASH had higher hepatic sterol regulatory element binding protein-1 (SREBP-1) expression (P<.03 NAFLD/NASH vs control). Laminin was used as a loading control. B. Rate of 3H-acetate and 14C-palmitate incorporation into triglycerides by hepatocytes was increased in NAFLD/NASH (P<.01) and decreased with progression to cirrhosis (P<.01 NAFLD/NASH vs cirrhosis). C. Rate of 3H-acetate into cholesterol in hepatocytes was significantly higher in NAFLD/NASH (P<.05 vs controls) and trended down with progression to cirrhosis (p=0.07 NAFLD/NASH vs cirrhosis). D. Desmosterol:total cholesterol ratio was significantly higher in subjects with NAFLD and NASH compared to lean and obese controls (P<.02 lean/obese controls vs. NAFLD/NASH). All data is presented as means ± S.E.M.
Figure 2
Figure 2. Impact of cirrhosis on hepatic lipid synthesis in NAFLD
A. Serum insulin concentrations are increased in patients with advanced fibrosis (P<.01 fibrotic stage 0–2 vs 3–4). B. Serum apolipoprotein-B:insulin ratio decreased significantly as patients with NAFLD progressed to cirrhosis (P=.02) C. Desmosterol:total cholesterol declined in patients with cirrhosis (P<.01 cirrhosis vs. fibrosis stage 0–2). There was no significant difference in sitosterol:total cholesterol ratio.
Figure 3
Figure 3. High-density lipoproteins in NAFLD
A. HDL particle size and concentration is decreased in NAFLD B. Serum concentrations of pre β-HDL is decreased in NAFLD (P<.01 controls). C. Cholesterol ester transfer protein was significantly lower in NAFLD/NASH (P<.01 vs controls). All data is presented as means ± S.E.M.

References

    1. Vernon G, Baranova A, Younossi ZM. Systematic review: the epidemiology and natural history of non-alcoholic fatty liver disease and non-alcholic steatohepatitis in adults. Hepatology. 2011;34:274–285. - PubMed
    1. Chalasani N, Younossi Z, Lavine JE, et al. The diagnosis and management of non-alcoholic fatty liver disease: Practice guideline by the american association for the study of liver diseases, American College of Gastroenterology, and the American Gastroenterological Association. Hepatology. 2012;55:n/a–n/a. - PubMed
    1. Adams LA, Lymp JF, St Sauver J, et al. The natural history of nonalcoholic fatty liver disease: a population-based cohort study. Gastroenterology. 2005;129:113–121. - PubMed
    1. Targher G, Day CP, Bonora E. Risk of cardiovascular disease in patients with nonalcoholic fatty liver disease. N Engl J Med. 2010;363:1341–1350. - PubMed
    1. Herder C, Karakas M, Koenig W. Biomarkers for the Prediction of Type 2 Diabetes and Cardiovascular Disease. Clinical Pharmacology & Therapeutics. 2011;90:52–66. - PubMed

Publication types