Review
. 2014 Dec;91(6):1203-17.
doi: 10.4269/ajtmh.14-0132. Epub 2014 Oct 13.

Review article: Research on dengue during World War II revisited

Affiliations
Review

Review article: Research on dengue during World War II revisited

Grace E Snow et al. Am J Trop Med Hyg. 2014 Dec.

Abstract

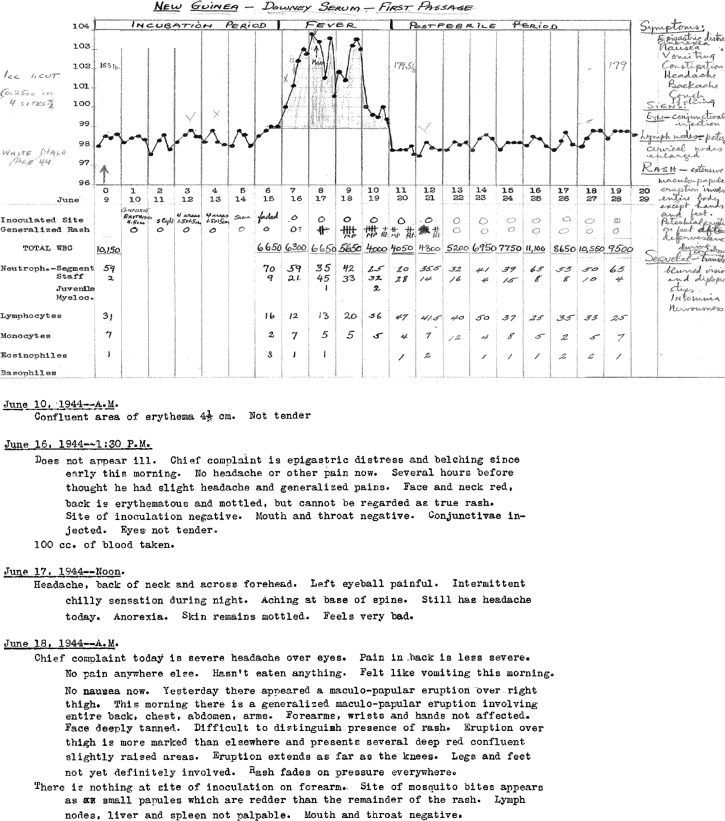
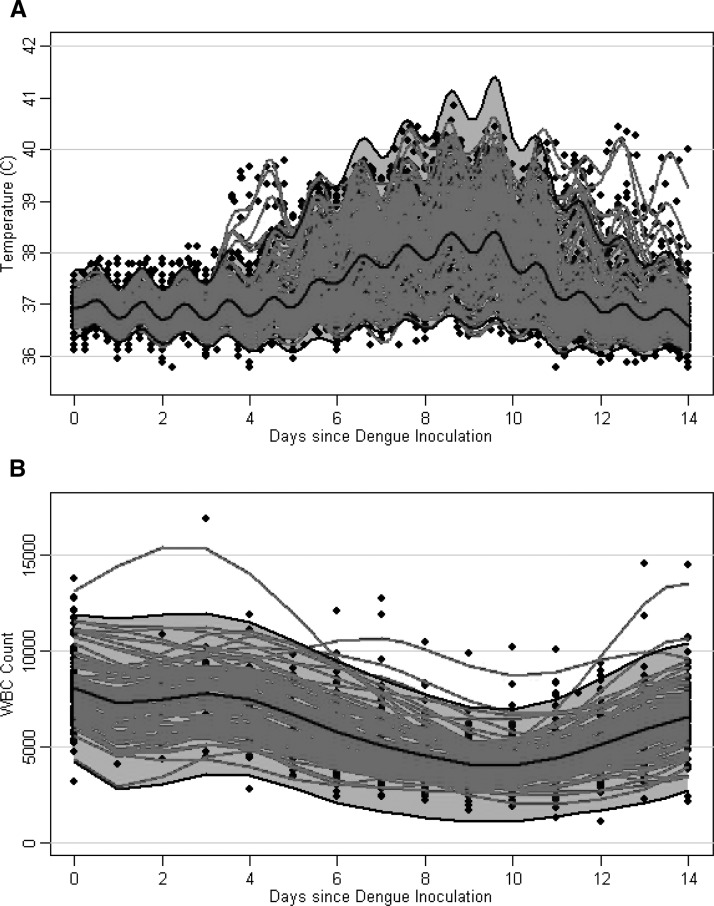
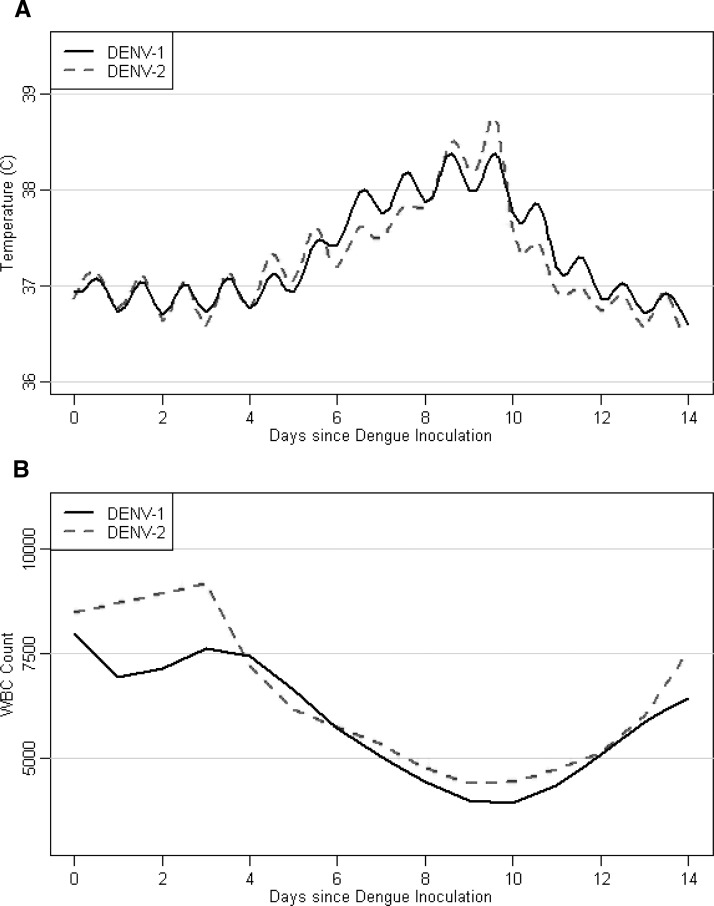
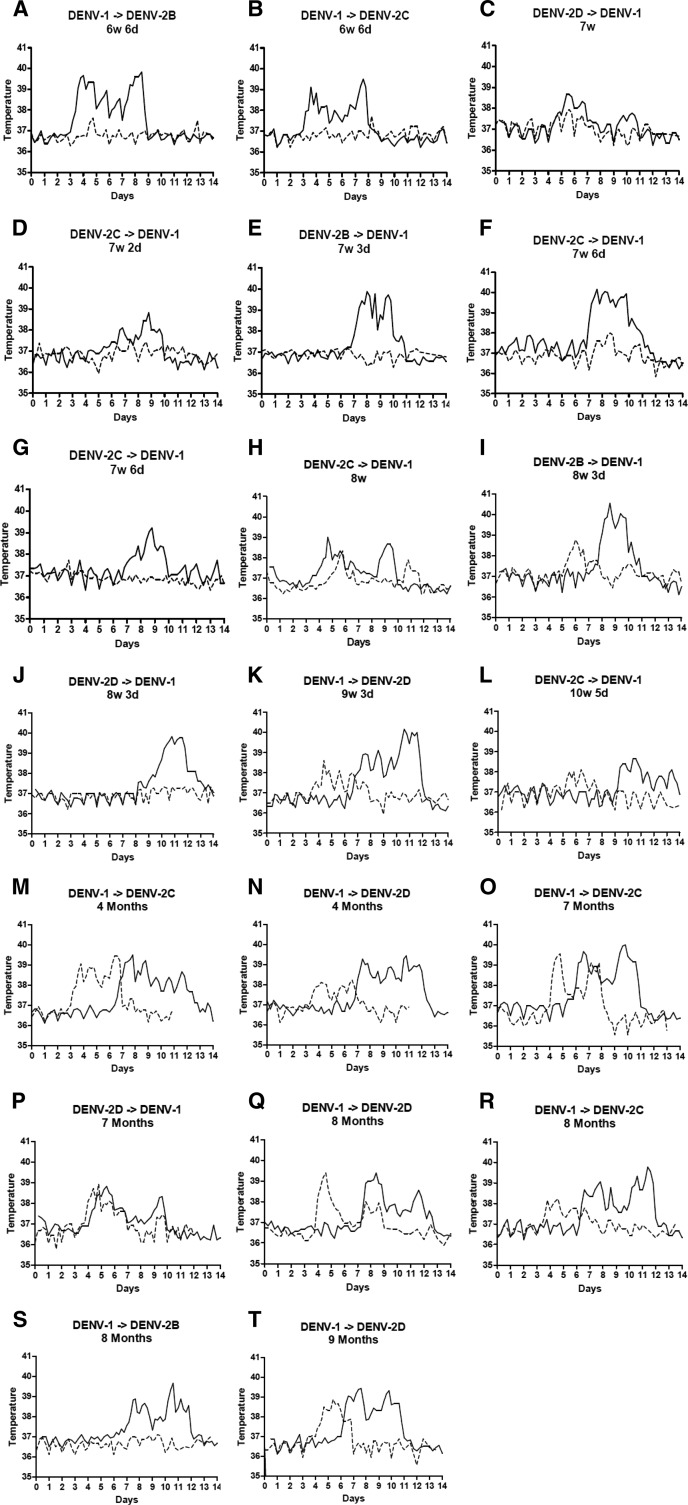
Much of the basic clinical information about dengue infection comes from experimental human studies conducted in the 1920s and 1940s. Albert Sabin's original laboratory records from one such study were bequeathed to Duane J. Gubler. These records were reviewed and 150 experiments were included in our analyses. Persons were inoculated with dengue virus 1 (DENV-1) and DENV-2. Median fever duration was shorter in primary DENV-2 infections compared with DENV-1, although maximum temperature and severity of illness were comparable. At 1.5-9 months after primary infection, 20 persons were inoculated with the heterologous serotype. Only one person inoculated with a heterologous serotype at < 8 weeks showed development of a clinical infection with a maximum temperature of 38°C, and 7 (88%) of 8 persons inoculated with a heterologous serotype at 4-9 months post-primary infection showed development of fever. On average, persons had a shorter incubation period in secondary infection compared with primary infection.


Figures

Figure 1.
Figure 1.
Examples of records from Albert Sabin's laboratory notebooks.
Figure 2.
Figure 2.
Temperature (A) and white blood cell (WBC) count (B) over time in 118 persons with a primary infection with dengue virus 1 (DENV-1) or DENV-2. Black dots represent persons’ temperature or WBC count data. Red curves represent subject-specific temperature or WBC count predictions, taking into account measurement error. Gray areas represent point-wise 95% prediction intervals, and black lines represent estimated mean curves.
Figure 3.
Figure 3.
Mean temperature (A) and white blood cell count (WBC) (B) over time in persons infected with dengue virus 1 (DENV-1) (n = 104, solid black line) or DENV-2 (n = 14, dashed red line).
Figure 4.
Figure 4.
Temperature over time in primary and secondary dengue infections in individual persons. Persons were inoculated with dengue virus 1 (DENV-1) and DENV-2 at time intervals ranging from 6 weeks and 6 days to 9 months. Time between primary and secondary inoculation is shown over each graph. Solid lines represent temperature in primary infection. Dotted lines represent secondary infection. DENV-2B, DENV-2C, and DENV-2D refer to DENV-2 isolated from three individual patients and subsequently inoculated into experimental subjects.

Similar articles

Cited by

References

    1. Bhatt S, Gething PW, Brady OJ, Messina JP, Farlow AW, Moyes CL, Drake JM, Brownstein JS, Hoen AG, Sankoh O, Myers MF, George DB, Jaenisch T, Wint GR, Simmons CP, Scott TW, Farrar JJ, Hay SI. The global distribution and burden of dengue. Nature. 2013;496:504–507. - PMC - PubMed
    1. Halstead SB. Pathogenesis of dengue: challenges to molecular biology. Science. 1988;239:476–481. - PubMed
    1. Murphy BR, Whitehead SS. Immune response to dengue virus and prospects for a vaccine. Annu Rev Immunol. 2011;29:587–619. - PubMed
    1. Bentsi-Enchill AD, Schmitz J, Edelman R, Durbin A, Roehrig JT, Smith PG, Hombach J, Farrar J. Long-term safety assessment of live attenuated tetravalent dengue vaccines: deliberations from a WHO technical consultation. Vaccine. 2013;31:2603–2609. - PMC - PubMed
    1. Zompi S, Harris E. Animal models of dengue virus infection. Viruses. 2012;4:62–82. - PMC - PubMed