. 2015 Mar 15;211(6):926-35.
doi: 10.1093/infdis/jiu560. Epub 2014 Oct 13.

The impact of clinical, demographic and risk factors on rates of HIV transmission: a population-based phylogenetic analysis in British Columbia, Canada

Affiliations

The impact of clinical, demographic and risk factors on rates of HIV transmission: a population-based phylogenetic analysis in British Columbia, Canada

Art F Y Poon et al. J Infect Dis. .

Abstract

Background: The diversification of human immunodeficiency virus (HIV) is shaped by its transmission history. We therefore used a population based province wide HIV drug resistance database in British Columbia (BC), Canada, to evaluate the impact of clinical, demographic, and behavioral factors on rates of HIV transmission.

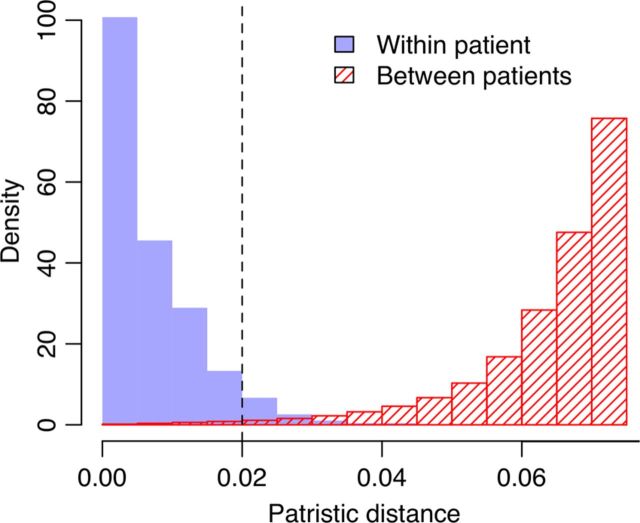
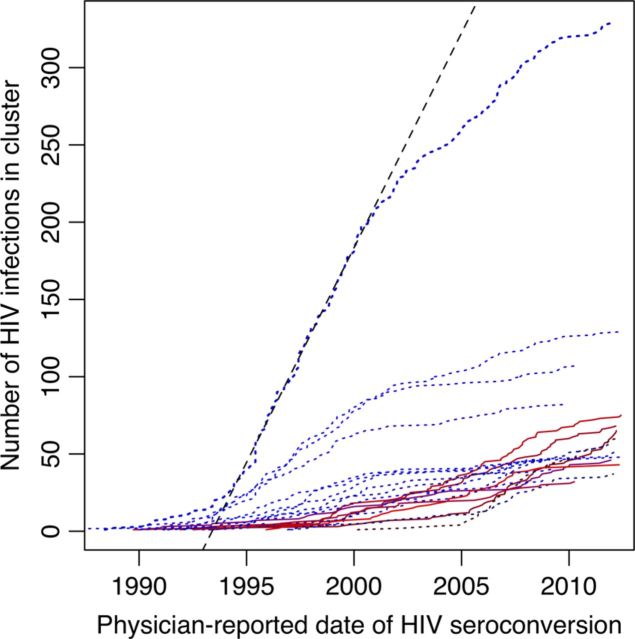
Methods: We reconstructed molecular phylogenies from 27,296 anonymized bulk HIV pol sequences representing 7747 individuals in BC-about half the estimated HIV prevalence in BC. Infections were grouped into clusters based on phylogenetic distances, as a proxy for variation in transmission rates. Rates of cluster expansion were reconstructed from estimated dates of HIV seroconversion.

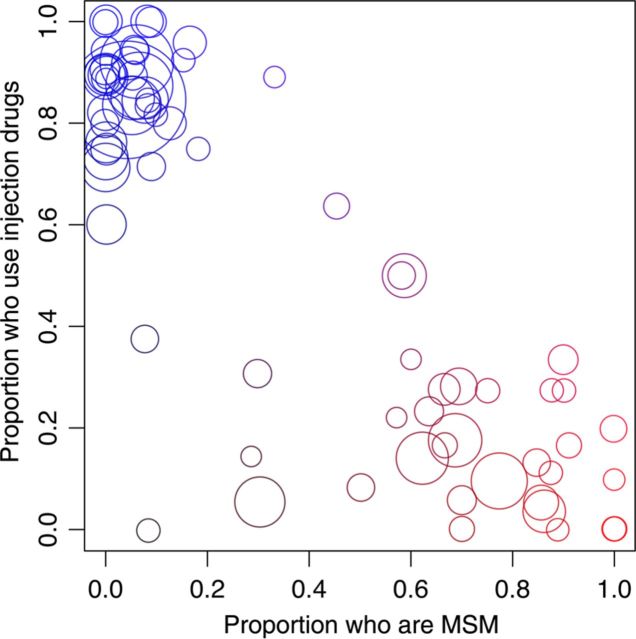
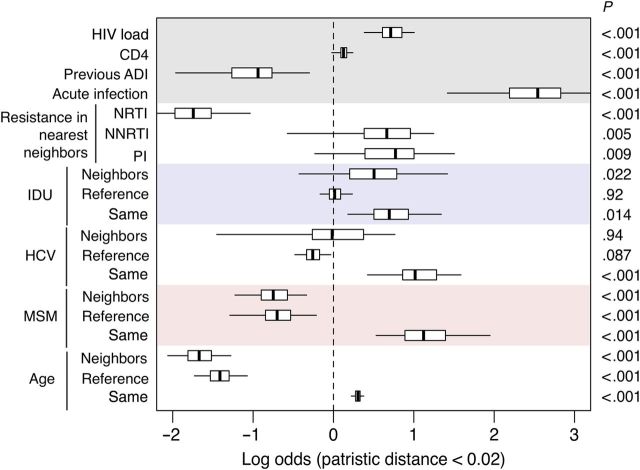
Results: Our criteria grouped 4431 individuals into 744 clusters largely separated with respect to risk factors, including large established clusters predominated by injection drug users and more-recently emerging clusters comprising men who have sex with men. The mean log10 viral load of an individual's phylogenetic neighborhood (composed of 5 other individuals with shortest phylogenetic distances) increased their odds of appearing in a cluster by >2-fold per log10 viruses per milliliter.

Conclusions: Hotspots of ongoing HIV transmission can be characterized in near real time by the secondary analysis of HIV resistance genotypes, providing an important potential resource for targeting public health initiatives for HIV prevention.

Keywords: human immunodeficiency virus (HIV); injection drug use; men who have sex with men (MSM); molecular epidemiology; phylogenetic clustering; transmission network.


Figures

Figure 1.
Figure 1.
Comparison of the mean patristic distance between human immunodeficiency virus (HIV) sequences from the same patient (solid) against the shortest distance between patients (hatched). The distances, measured in units of expected nucleotide substitutions per site, were extracted from the maximum likelihood estimate of the phylogeny reconstructed from the original HIV sequence alignment (without bootstrap resampling). The cutoff used in our study (dashed line, 0.02 expected nucleotide substitutions per site) corresponded to the 95% quantile of intrapatient distances (0.1% quantile of interpatient distances). Histograms were scaled such that the total area sums to 1; the interpatient histogram was truncated at 0.075.
Figure 2.
Figure 2.
Scatterplot of all phylogenetic clusters with ≥10 individuals (n = 71) indicating the proportion of individuals having ever used injection drugs and the proportion reporting male-male sex. Denominators of these proportions were adjusted for cases with missing values. Each circle represents a cluster; the area of each circle is scaled in proportion to the number of individuals in that cluster. Circles are colored red and blue in proportion to the cluster-specific prevalence of MSM and injection drug use, respectively, to underscore contrasts in the composition of clusters with respect to these risk factors. Abbreviation: MSM, men who have sex with men.
Figure 3.
Figure 3.
Summary of multivariate logistic regressions on the odds of cluster membership. For each individual, we identified their earliest human immunodeficiency virus (HIV) sequence and then located the 5 most closely related sequences from 5 other individuals (so-called nearest neighbors) for a given phylogenetic tree. We repeated this search across all 100 bootstrap replicate trees. The purpose of this calculation was to derive predictor variables characterizing the subgroup of the population from which a given individual's infection could have originated. For example, one might expect elevated transmission rates within subgroups in which infected individuals tend to carry higher viral loads than the population average. To evaluate the impact of such predictors on variation in rates of transmission, we fit a generalized linear model with a logit link function to the odds that an individual appeared in a phylogenetic cluster (n = 4827 because of missing data). A line segment indicates the median effect, and lines are drawn to indicate the empirical 95% confidence interval. “Reference” indicates variables associated with the reference individual. “Neighbors” indicates model terms calculated from averaging the variable over nearest neighbor individuals. HIV load, CD4+ T-cell count (CD4), previous AIDS-defining illness (ADI), and acute infection also represent nearest neighbor averages. “Same” indicates an interaction effect between neighbor and reference terms; for example, when both the reference individual and their nearest neighbors were younger than the mean population age, the reference was significantly more likely to appear in a cluster. HIV load effects were scaled to log10 HIV RNA copies/mL. CD4 effects were scaled to 100 cells/mL. Age effects were scaled to decades. P values are associated with the bootstrap replicate yielding the median coefficient estimate for the respective model terms. Abbreviations: HCV, hepatitis C virus; IDU, injection drug use; MSM, men who have sex with men; NNRTI, nonnucleoside reverse transcriptase inhibitor; NRTI, nucleoside reverse transcriptase inhibitor; PI, protease inhibitor.
Figure 4.
Figure 4.
Growth of the 20 largest phylogenetic clusters with respect to estimated dates of human immunodeficiency virus (HIV) seroconversion based predominantly on physician reports. Each trend line represents the accumulation of persons within the corresponding cluster. Dotted blue lines indicate clusters predominantly of injection drug users, and solid red lines indicate clusters predominantly of men who have sex with men (as in Table 2). These trends were averaged over 100 imputations of missing date estimates (n = 3668). A dashed line indicates the maximum rate of growth of the largest cluster, which was estimated to have occurred between 1996 and 2001.

Comment in

References

    1. Schechter MT, Boyko WJ, Douglas B, et al. The Vancouver Lymphadenopathy-AIDS Study: 6. HIV seroconversion in a cohort of homosexual men. CMAJ. 1986;135:1355. - PMC - PubMed
    1. Hogg RS, Strathdee SA, Craib KJ, O'Shaughnessy MV, Montaner JS, Schechter MT. Modelling the impact of HIV disease on mortality in gay and bisexual men. Int J Epidemiol. 1997;26:657–61. - PubMed
    1. Tyndall MW, Currie S, Spittal P, et al. Intensive injection cocaine use as the primary risk factor in the Vancouver HIV-1 epidemic. AIDS. 2003;17:887–93. - PubMed
    1. Hyshka E, Strathdee S, Wood E, Kerr T. Needle exchange and the HIV epidemic in Vancouver: lessons learned from 15 years of research. Int J Drug Policy. 2012;23:261–70. - PMC - PubMed
    1. McInnes CW, Druyts E, Harvard SS, et al. HIV/AIDS in Vancouver, British Columbia: a growing epidemic. Harm Reduct J. 2009;6:5. - PMC - PubMed

Publication types

Substances