. 2015 Jan 1:104:398-412.
doi: 10.1016/j.neuroimage.2014.10.002. Epub 2014 Oct 12.

Machine learning framework for early MRI-based Alzheimer's conversion prediction in MCI subjects

Collaborators, Affiliations

Machine learning framework for early MRI-based Alzheimer's conversion prediction in MCI subjects

Elaheh Moradi et al. Neuroimage. .

Abstract

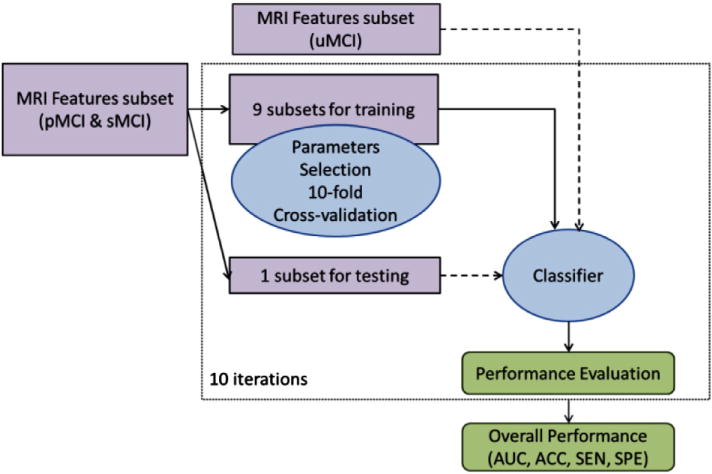
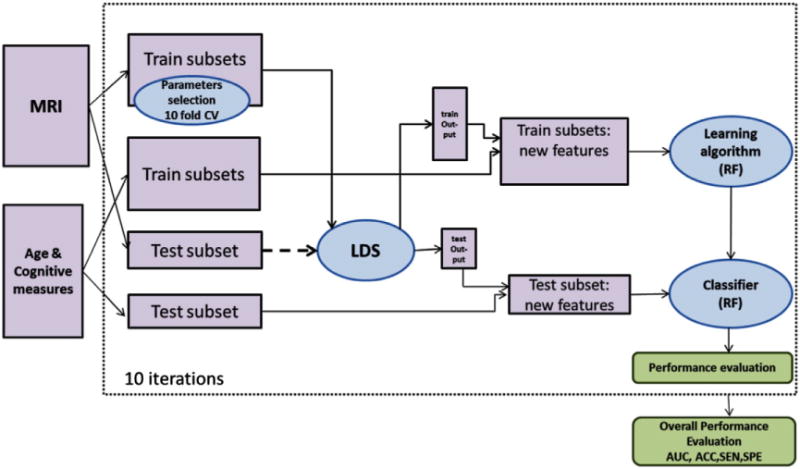
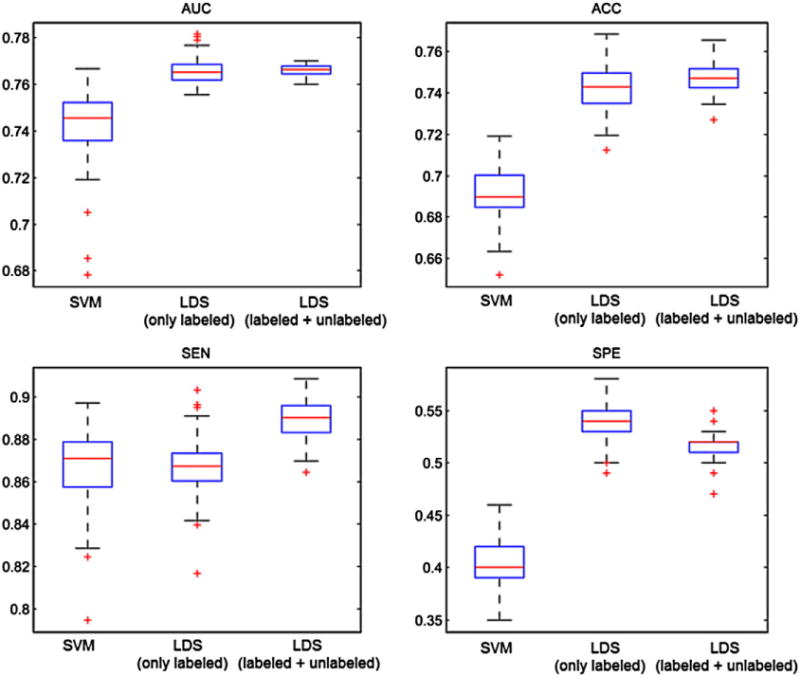
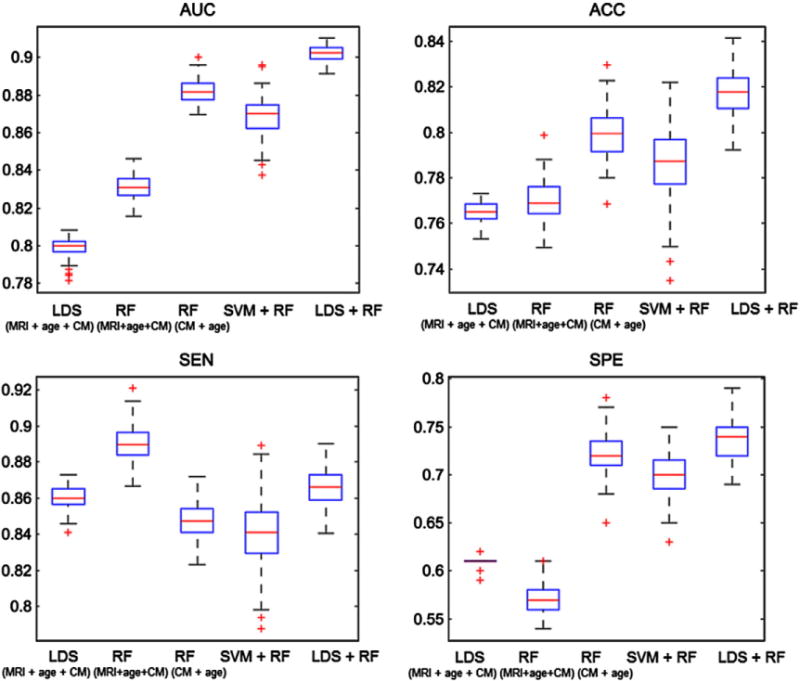
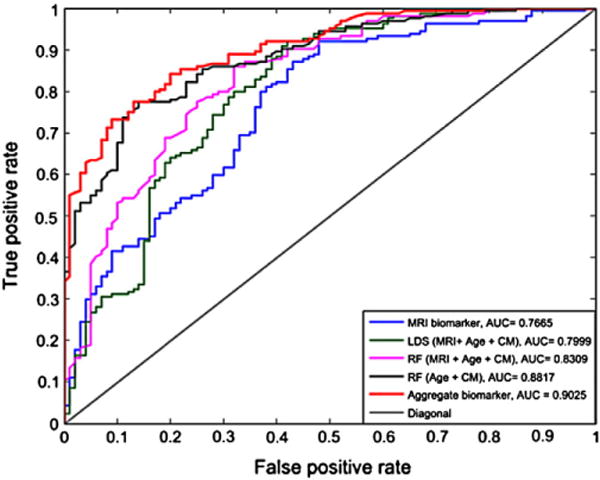
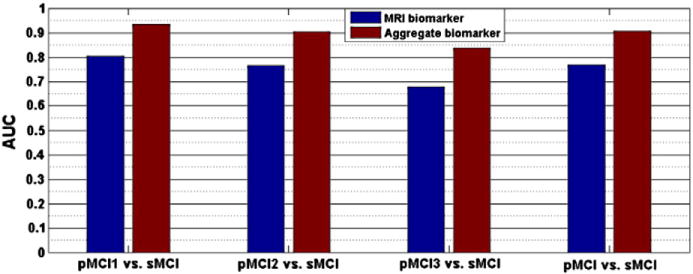
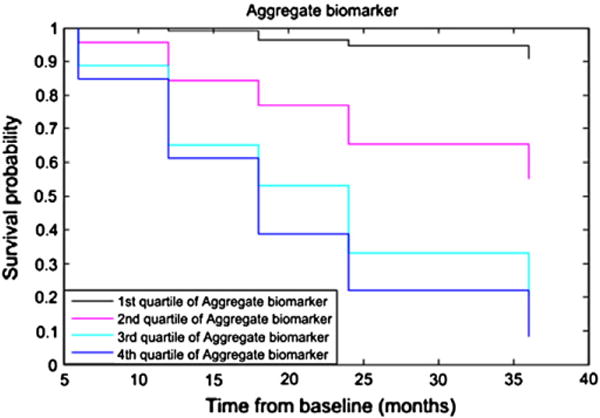
Mild cognitive impairment (MCI) is a transitional stage between age-related cognitive decline and Alzheimer's disease (AD). For the effective treatment of AD, it would be important to identify MCI patients at high risk for conversion to AD. In this study, we present a novel magnetic resonance imaging (MRI)-based method for predicting the MCI-to-AD conversion from one to three years before the clinical diagnosis. First, we developed a novel MRI biomarker of MCI-to-AD conversion using semi-supervised learning and then integrated it with age and cognitive measures about the subjects using a supervised learning algorithm resulting in what we call the aggregate biomarker. The novel characteristics of the methods for learning the biomarkers are as follows: 1) We used a semi-supervised learning method (low density separation) for the construction of MRI biomarker as opposed to more typical supervised methods; 2) We performed a feature selection on MRI data from AD subjects and normal controls without using data from MCI subjects via regularized logistic regression; 3) We removed the aging effects from the MRI data before the classifier training to prevent possible confounding between AD and age related atrophies; and 4) We constructed the aggregate biomarker by first learning a separate MRI biomarker and then combining it with age and cognitive measures about the MCI subjects at the baseline by applying a random forest classifier. We experimentally demonstrated the added value of these novel characteristics in predicting the MCI-to-AD conversion on data obtained from the Alzheimer's Disease Neuroimaging Initiative (ADNI) database. With the ADNI data, the MRI biomarker achieved a 10-fold cross-validated area under the receiver operating characteristic curve (AUC) of 0.7661 in discriminating progressive MCI patients (pMCI) from stable MCI patients (sMCI). Our aggregate biomarker based on MRI data together with baseline cognitive measurements and age achieved a 10-fold cross-validated AUC score of 0.9020 in discriminating pMCI from sMCI. The results presented in this study demonstrate the potential of the suggested approach for early AD diagnosis and an important role of MRI in the MCI-to-AD conversion prediction. However, it is evident based on our results that combining MRI data with cognitive test results improved the accuracy of the MCI-to-AD conversion prediction.

Keywords: ADNI; Alzheimer's disease; Classification; Early diagnosis; Feature selection; Low density separation; Magnetic resonance imaging; Mild cognitive impairment; Semi-supervised learning; Support vector machine.


Figures

Fig. 1
Fig. 1
Semi-supervised classification scheme. Dashed arrows indicate data fed to classification process without any label information (in contrast to solid arrows indicating training data with label information). The test subset is used in the classification process without any label information.
Fig. 2
Fig. 2
Workflow for the aggregate biomarker and its cross-validation based evaluation. For computing the output of LDS classifier for test subjects, the test subset is used in the learning procedure without any label information (shown with dashed arrow).
Fig. 3
Fig. 3
The locations of selected voxels by elastic-net RLR with the highest accuracy in discriminating AD and NC subjects within the brain in MNI (Montreal Neurological Institute) space. One of the voxels appears to be slightly outside the brain due to the effect of smoothing and the larger voxel size of the pre-processed data compared to the voxel size of the template.
Fig. 4
Fig. 4
Box plots for AUC, ACC, SEN and SPE of SVM and LDS methods based on MRI data with selected features and removed age-related effects, within 100 computation times. In the case of LDS, the depicted results are obtained with (LDS-labeled + unlabeled) and without (LDS-only labeled) utilizing uMCI subjects in the learning. On each box, the central mark is the median (red line), the edges of the box are the 25th and 75th percentiles, the whiskers extend to the most extreme data points not considered outliers, and outliers are plotted with a +.
Fig. 5
Fig. 5
Box plots for AUC, ACC, SEN and SPE of RF, LDS and aggregate biomarker with LDS + RF and with SVM + RF, using MRI with cognitive measurements within 100 computation times. On each box, the central mark shown in red is the median, the edges of the box are the 25th and 75th percentiles, the whiskers extend to the most extreme data points not considered outliers, and outliers are plotted with a +. The abbreviation CM refers to cognitive measurements. The data for LDS (MRI + age + CM) and RF (MRI + age + CM) was formed by simple data concatenation.
Fig. 6
Fig. 6
ROC curves of subject’s classification to sMCI or pMCI using classification methods, LDS, SVM and aggregate biomarker using only MRI and MRI with age and cognitive measurements. Each ROC curve is from a cross-validation run with the median AUC within 100 cross-validation runs.
Fig. 7
Fig. 7
The AUC of MRI biomarker and aggregate biomarker for classification of different pMCI groups. pMCI1: if diagnosis was MCI at baseline but converted to AD within the first 12 months, pMCI2: if diagnosis was MCI at baseline and conversion to AD occurred within the 2nd year of follow-up (24 months), pMCI3: if diagnosis was MCI at baseline and conversion to AD was reported at 36 months follow-up.
Fig. 8
Fig. 8
Kaplan–Meier survival curve for aggregate biomarker by splitting the predictor into quartiles. The follow-up period is truncated at 36 months.
Fig. 9
Fig. 9
The importance of MRI, age and cognitive measurements calculated by RF classifier. ADAS-cog total 11 and ADAS-cog total Mod are weighted averages of 13 ADAS subscores, ADAS-cog subscore Q4 (delayed word recall) and Q14 (number cancelation) are not included in the ADAS-cog total 11. RAVLT is RAVLT-immediate that is sum score for 5 learning trials. The AUC of each individual feature was calculated using RF except for MRI that LDS was used. MRI: 0.7661, RAVLT: 0.7172, ADAS-cog total-11: 0.7185, FAQ: 0.7290, ADAS-cog total Mod: 0.6554, age: 0.5573, CDR-SB: 0.6789, MMSE: 0.6154.

References

    1. Adaszewski S, Dukart J, Kherif F, Frackowiak R, Draganski B. How early can we predict Alzheimer’s disease. Neurobiol Aging. 2013;34(12):2815–2826. - PubMed
    1. Ambroise C, Mclachlan GJ. Selection bias in gene extraction on the basis of microarray gene-expression data. Proc Natl Acad Sci. 2002;99(10):6562–6566. - PMC - PubMed
    1. Ashburner J, Friston KJ. Unified segmentation. Neuroimage. 2005;26(3):839–851. - PubMed
    1. Barnes DE, Yaffe K. The projected effect of risk factor reduction on Alzheimer’s disease prevalence. Lancet Neurol. 2011;10(9):819–828. - PMC - PubMed
    1. Batmanghelich KN, Ye DH, Pohl KM, Taskar B, Davatzikos C. Biomedical Imaging: From Nano to Macro, 2011 IEEE International Symposium on. IEEE; 2011. Disease classification and prediction via semi-supervised dimensionality reduction; pp. 1086–1090. - PMC - PubMed

Publication types