. 2015 Jan;32(1):258-67.
doi: 10.1093/molbev/msu286. Epub 2014 Oct 13.

Phylostratigraphic bias creates spurious patterns of genome evolution

Affiliations

Phylostratigraphic bias creates spurious patterns of genome evolution

Bryan A Moyers et al. Mol Biol Evol. 2015 Jan.

Erratum in

Abstract

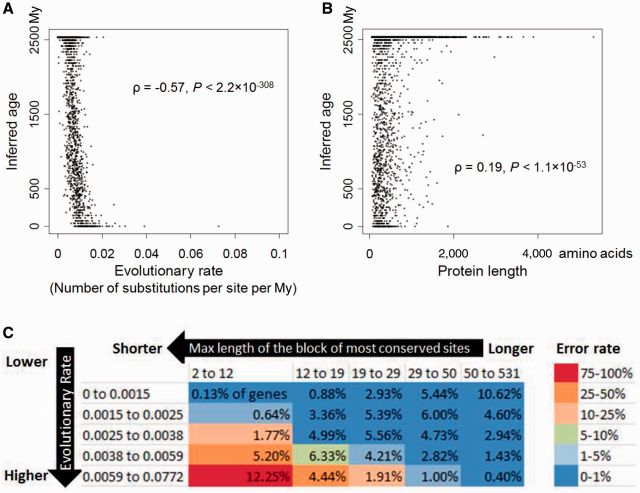
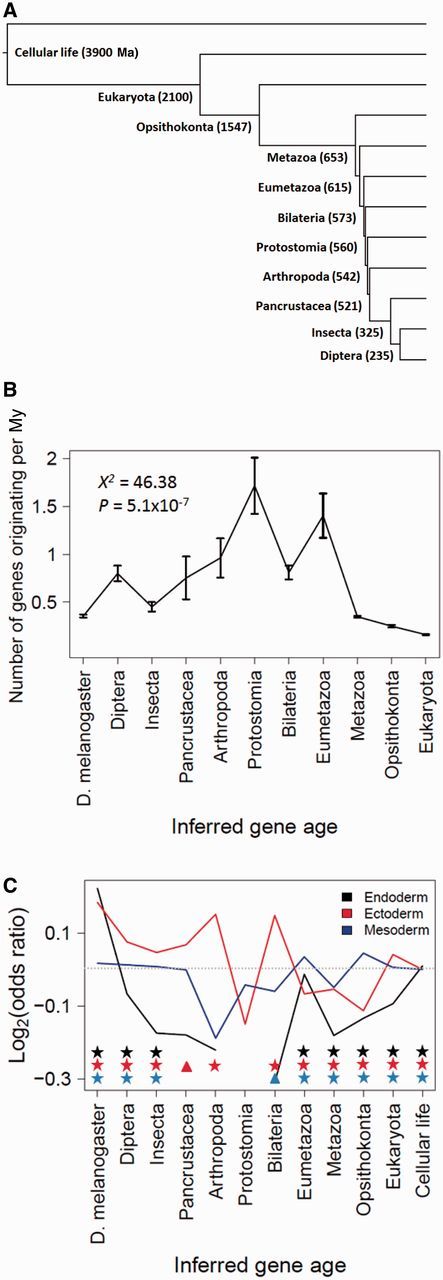
Phylostratigraphy is a method for dating the evolutionary emergence of a gene or gene family by identifying its homologs across the tree of life, typically by using BLAST searches. Applying this method to all genes in a species, or genomic phylostratigraphy, allows investigation of genome-wide patterns in new gene origination at different evolutionary times and thus has been extensively used. However, gene age estimation depends on the challenging task of detecting distant homologs via sequence similarity, which is expected to have differential accuracies for different genes. Here, we evaluate the accuracy of phylostratigraphy by realistic computer simulation with parameters estimated from genomic data, and investigate the impact of its error on findings of genome evolution. We show that 1) phylostratigraphy substantially underestimates gene age for a considerable fraction of genes, 2) the error is especially serious when the protein evolves rapidly, is short, and/or its most conserved block of sites is small, and 3) these errors create spurious nonuniform distributions of various gene properties among age groups, many of which cannot be predicted a priori. Given the high likelihood that conclusions about gene age are faulty, we advocate the use of realistic simulation to determine if observations from phylostratigraphy are explainable, at least qualitatively, by a null model of biased measurement, and in all cases, critical evaluation of results.

Keywords: BLAST; gene age; phylogenetic dating.


Figures

F<sc>ig</sc>. 1.
Fig. 1.
BLAST error rates at different divergence times. (A) Phylogeny showing the relationship of simulated sequences in this study. Organism names are for reference only. Branch lengths are proportional to divergence times, the sources of which are detailed in Materials and Methods. INT1 and INT2 are not true taxa, but are equally spaced between plant and bacterial divergence to allow a smoother range of distances. (B) Fraction (f) of proteins from a taxon that are missed by BLAST increases nonlinearly with the time (t) since the divergence between the taxon and the query taxon (fruit fly). We found that the relationship between f and t is better described by a log-linear function than a linear function, with the Akaike information criterion (AIC) of the former 23.87 units smaller than the latter. Shown are the averages from ten simulations, with the error bars depicting the range from the ten simulations.
F<sc>ig</sc>.
2.
Fig. 2.
Gene age inference by BLAST is influenced by (A) protein evolutionary rate, (B) protein length, and (C) the maximum length of the block of the most conserved sites in the protein. Presented are the average results from ten simulations. In (A) and (B), each dot represents one fruit fly protein, whose age equals the average inferred age over ten simulations. In (C), each row and each column represents an equal number of genes. The number in each bin corresponds to the fraction of genes from ten simulations that fall into the bin. The color of each bin represents the average error rate in that bin, with the color scheme shown on the right of the figure. Error was considered when a gene was inferred to have originated after the separation between bacteria and eukaryotes. Max length is in the unit of amino acid, whereas evolutionary rate is in the unit of number of substitutions per site per My. As shown in the main text by partial correlations, each of the three factors has a significant contribution to BLAST error even when the other two are controlled.
F<sc>ig</sc>. 3.
Fig. 3.
BLAST error mimics findings in Drosophila genomic phylostratigraphy. Shown are results from analysis of simulated data, in which all proteins originated in the common ancestor of cellular life. (A) Phylogeny along which protein evolution is simulated. Both the tree topology and node ages (shown in parentheses) are from Domazet-Lošo et al. (2007). (B) The inferred number of new gene originations per My determined by dividing the number of genes inferred to have originated in a tree branch by the time represented by the branch, averaged over ten simulations. Error bars represent standard deviations. The null hypothesis of equal numbers of gene originations per My across all strata was examined by a chi-squared test. (C) Over and underrepresentation of genes of certain ages at three expression sites during Drosophila embryonic development. Positive values of log (odds ratio) indicate overrepresentation, whereas negative values indicate underrepresentation. The dotted line indicates log (odds ratio) = 0. Protostomia did not have any new gene that is expressed in the endoderm, and thus produced an undefined log (odds ratio), which was not presented. Triangles denote a P value of < 0.025, whereas stars denote an associated P value of < 0.001. See Materials and Methods for calculation of log(odds ratio).
<sc>Fig</sc>. 4.
Fig. 4.
BLAST error mimics the finding in human genomic phylostratigraphy that old genes are more likely than young genes to be disease genes. Shown are results from analysis of simulated data, in which all proteins originated in the common ancestor of eukaryotes and bacteria. The time (in My) since divergence between each taxon and human is from TimeTree and is shown in parentheses.
<sc>Fig</sc><sc>.</sc> 5.
Fig. 5.
Phylostratigraphy produces signals beyond what BLAST error can account for. Black bars represent the percentage of fruit fly genes inferred to be in each phylostratum based on the real phylostratigraphic analysis of Domazet-Lošo et al. (2007). Gray bars represent the percentage of fruit fly genes inferred to be in each phylostratum in our simulated phylostratigraphic analysis. The simulation is the same as in figure 3.

Similar articles

Cited by

References

    1. Abrusán G. Integration of new genes into cellular networks, and their structural maturation. Genetics. 2013;195:1407–1417. - PMC - PubMed
    1. Albà MM, Castresana J. Inverse relationship between evolutionary rate and age of mammalian genes. Mol Biol Evol. 2005;22:598–606. - PubMed
    1. Albà MM, Castresana J. On homology searches by protein Blast and the characterization of the age of genes. BMC Evol Biol. 2007;7:53. - PMC - PubMed
    1. Altschul SF, Gish W, Miller W, Myers EW, Lipman DJ. Basic local alignment search tool. J Mol Biol. 1990;215:403–410. - PubMed
    1. Altschul SF, Madden TL, Schäffer AA, Zhang J, Zhang Z, Miller W, Lipman DJ. Gapped BLAST and PSI-BLAST: a new generation of protein database search programs. Nucleic Acids Res. 1997;25:3389–3402. - PMC - PubMed

Publication types

LinkOut - more resources