. 2015 Mar;179(3):454-65.
doi: 10.1111/cei.12468.

Early dynamics of T helper cell cytokines and T regulatory cells in response to treatment of active Mycobacterium tuberculosis infection

Affiliations

Early dynamics of T helper cell cytokines and T regulatory cells in response to treatment of active Mycobacterium tuberculosis infection

S L Feruglio et al. Clin Exp Immunol. 2015 Mar.

Erratum in

  • Erratum.
    [No authors listed] [No authors listed] Clin Exp Immunol. 2015 Jul;181(1):189-90. doi: 10.1111/cei.12653. Clin Exp Immunol. 2015. PMID: 26051743 Free PMC article. No abstract available.

Abstract

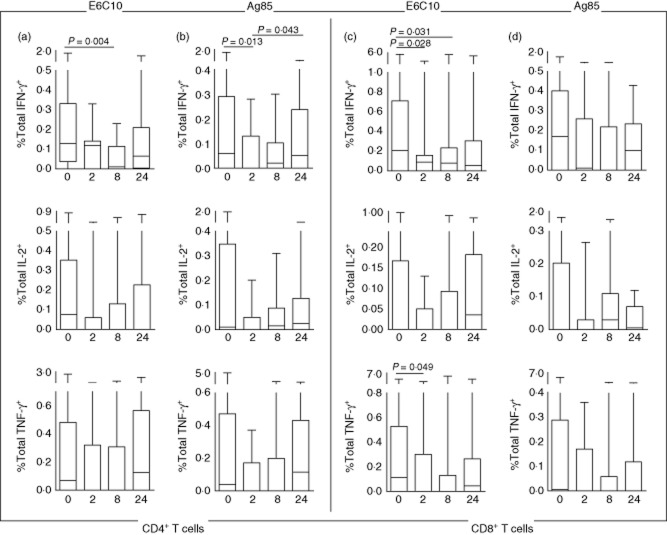
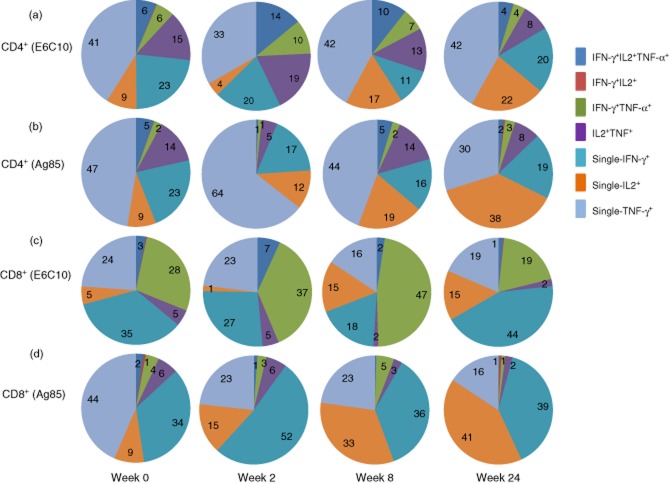
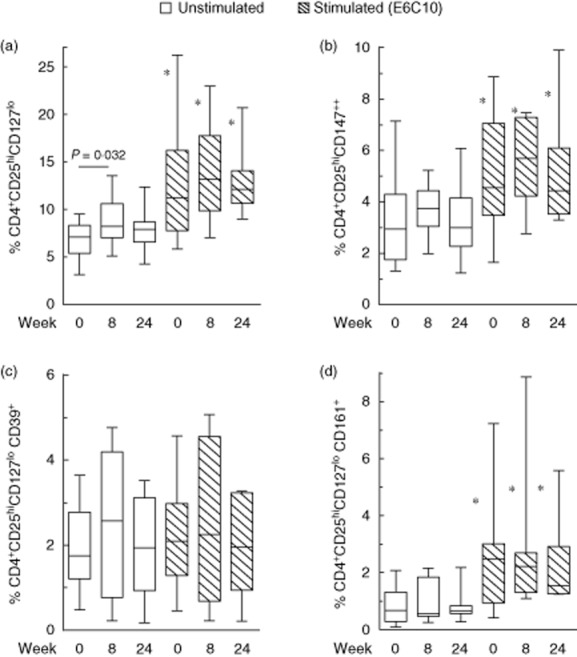
Biomarkers that can identify tuberculosis (TB) disease and serve as markers for efficient therapy are requested. We have studied T cell cytokine production [interferon (IFN)-γ, interleukin (IL)-2, tumour necrosis factor (TNF)-α] and degranulation (CD107a) as well as subsets of CD4(+) T regulatory cells (Tregs ) after in-vitro Mycobacterium tuberculosis (Mtb) antigen stimulation [early secretory antigenic target (ESAT)-6, culture filtrate protein (CFP)-10, antigen 85 (Ag85)] in 32 patients with active tuberculosis (TB) disease throughout 24 weeks of effective TB treatment. A significant decline in the fraction of Mtb-specific total IFN-γ and single IFN-γ-producing T cells was already observed after 2 weeks of treatment, whereas the pool of single IL-2(+) cells increased over time for both CD4(+) and CD8(+) T cells. The Treg subsets CD25(high) CD127(low) , CD25(high) CD147(++) and CD25(high) CD127(low) CD161(+) expanded significantly after Mtb antigen stimulation in vitro at all time-points, whereas the CD25(high) CD127(low) CD39(+) Tregs remained unchanged. The fraction of CD25(high) CD127(low) Tregs increased after 8 weeks of treatment. Thus, we revealed an opposing shift of Tregs and intracellular cytokine production during treatment. This may indicate that functional signatures of the CD4(+) and CD8(+) T cells can serve as immunological correlates of early curative host responses. Whether such signatures can be used as biomarkers in monitoring and follow-up of TB treatment needs to be explored further.

Keywords: T cells; Tregs; cytokines; treatment; tuberculosis.


Figures

Fig 1
Fig 1
Total Mycobacterium tuberculosis (Mtb) antigen-specific interferon (IFN)-γ+, interleukin (IL)-2+ or tumour necrosis factor (TNF)-α+ T cell responses at different time-points of tuberculosis (TB) treatment: baseline (n = 20), week 2 (n = 11), week 8 (n = 18), week 24 (n = 20). (a) Early secretory antigenic target (ESAT)-6/culture filtrate protein (CFP)-10 (E6C10)-stimulated CD4+ T cells. (b) Antigen 85 (Ag85)-stimulated CD4+ T cells. (c) E6C10-stimulated CD8+ T cells. (d) Ag85-stimulated CD8+ T cells. P-values calculated by Wilcoxon's matched-pairs test. Plots are shown with median, interquartile range (IQR) and minimum/maximum values.
Fig 2
Fig 2
Mycobacterium tuberculosis (Mtb) antigen-specific cytokine T cell subsets at different time-points of tuberculosis (TB) treatment: baseline (n = 20), week 2 (n = 11), week 8 (n = 18), week 24 (n = 20). Boolean gating strategy was used to create cytokine combinations of single-producing, duo-producing and polyfunctional T cells. (a) Early secretory antigenic target (ESAT)-6/culture filtrate protein (CFP)-10 (E6C10)-stimulated CD4+ T cells. (b) Antigen 85 (Ag85)-stimulated CD4+ T cells. (c) E6C10 stimulated CD8+ T cells. (d) Ag85-stimulated CD8+ T cells. P-values calculated by Wilcoxon's matched-pairs test. Plots are shown with median, interquartile range (IQR) and minimum/maximum values.
Fig 3
Fig 3
Piecharts representing percentages of the various cytokine combinations to the overall pool of cytokine producing CD4+ and CD8+ T cells at different time-points during treatment: week 0 (n = 20), week 2 (n = 11), week 8 (n = 18) and week 24 (n = 20). (a) Early secretory antigenic target (ESAT)-6/culture filtrate protein (CFP)-10 (E6C10)-stimulated CD4+ T cells. (b) Antigen 85 (Ag85)-stimulated CD4+ T cells. (c) E6C10-stimulated CD8+ T cells. (d) Ag85-stimulated CD8+ T cells.
Fig 4
Fig 4
The fraction of regulatory T cell (Treg) subsets in tuberculosis (TB) patients before (n = 12) and after 8 (n = 11) and 24 weeks (n = 11) of TB treatment in unstimulated (white bars) and early secretory antigenic target (ESAT)-6/culture filtrate protein (CFP)-10 (E6C10)-stimulated peripheral blood mononuclear cells (PBMC) (hatched bars). (a) CD4+CD25hiCD127low, (b) CD4+CD25hiCD127lowCD147++, (c) CD4+CD25hiCD127lowCD39+ and (d) CD4+CD25hiCD127lowCD161+. *Significant changes (P < 0·005) between unstimulated and E6C10-stimulated samples at corresponding time-points. P-values calculated by Wilcoxon's matched-pairs test. Plots are shown with median, interquartile range (IQR) and minimum/maximum values.
Fig 5
Fig 5
Fraction of regulatory T cells (Tregs) (CD4+CD25hiCD127low) in unstimulated and early secretory antigenic target (ESAT)-6/culture filtrate protein (CFP)-10 (E6C10)-stimulated peripheral blood mononuclear cells (PBMC) during treatment at baseline (week 0), week 8 and week 24 in (a) high (white bars, n = 6) versus low (hatched bars, n = 6) symptom score and (b) pulmonary tuberculosis (PTB) (white bars, n = 6) versus extrapulmonary tuberculosis (EPTB) (dotted bars, n = 6). Plots are shown with median, interquartile range (IQR) and minimum/maximum values. P-values were calculated by Mann–Whitney U-test.

Similar articles

Cited by

References

    1. World Health Organization (WHO) 2013. Global Tuberculosis Report . Geneva: WHO; WHO/HTM/TB/2013.13.
    1. Wallis RS, Kim P, Cole S, et al. Tuberculosis biomarkers discovery: developments, needs, and challenges. Lancet Infect Dis. 2013;13:362–372. - PubMed
    1. Gandhi NR, Nunn P, Dheda K, et al. Multidrug-resistant and extensively drug-resistant tuberculosis: a threat to global control of tuberculosis. Lancet. 2010;375:1830–1843. - PubMed
    1. Dheda K, Schwander SK, Zhu B, Van Zyl-Smit RN, Zhang Y. The immunology of tuberculosis: from bench to bedside. Respirology. 2010;15:433–450. - PMC - PubMed
    1. O'Garra A, Redford PS, McNab FW, Bloom CI, Wilkinson RJ, Berry MP. The immune response in tuberculosis. Annu Rev Immunol. 2013;31:475–527. - PubMed

Publication types

MeSH terms