. 2014 Oct 13;6(10):2866-82.
doi: 10.1093/gbe/evu225.

The genomic diversification of the whole Acinetobacter genus: origins, mechanisms, and consequences

Affiliations

The genomic diversification of the whole Acinetobacter genus: origins, mechanisms, and consequences

Marie Touchon et al. Genome Biol Evol. .

Abstract

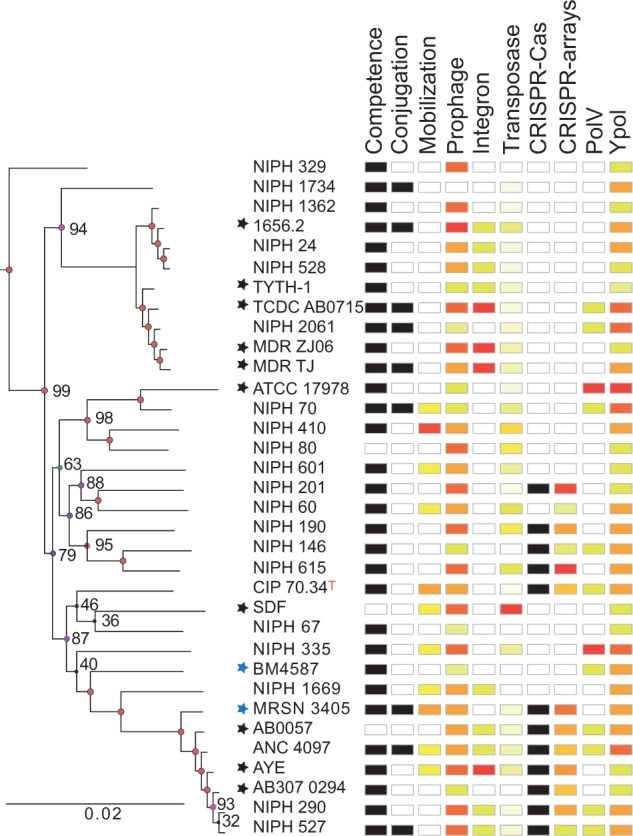
Bacterial genomics has greatly expanded our understanding of microdiversification patterns within a species, but analyses at higher taxonomical levels are necessary to understand and predict the independent rise of pathogens in a genus. We have sampled, sequenced, and assessed the diversity of genomes of validly named and tentative species of the Acinetobacter genus, a clade including major nosocomial pathogens and biotechnologically important species. We inferred a robust global phylogeny and delimited several new putative species. The genus is very ancient and extremely diverse: Genomes of highly divergent species share more orthologs than certain strains within a species. We systematically characterized elements and mechanisms driving genome diversification, such as conjugative elements, insertion sequences, and natural transformation. We found many error-prone polymerases that may play a role in resistance to toxins, antibiotics, and in the generation of genetic variation. Surprisingly, temperate phages, poorly studied in Acinetobacter, were found to account for a significant fraction of most genomes. Accordingly, many genomes encode clustered regularly interspaced short palindromic repeats (CRISPR)-Cas systems with some of the largest CRISPR-arrays found so far in bacteria. Integrons are strongly overrepresented in Acinetobacter baumannii, which correlates with its frequent resistance to antibiotics. Our data suggest that A. baumannii arose from an ancient population bottleneck followed by population expansion under strong purifying selection. The outstanding diversification of the species occurred largely by horizontal transfer, including some allelic recombination, at specific hotspots preferentially located close to the replication terminus. Our work sets a quantitative basis to understand the diversification of Acinetobacter into emerging resistant and versatile pathogens.

Keywords: bacterial genus; comparative genomics; evolution; mobile genetic elements; nosocomial pathogens.


Figures

F<sc>ig</sc>. 1.—
Fig. 1.—
Core- and pan-genomes of the genus and of A. baumannii (left) and spectrum of frequencies for A. baumannii gene repertoires (right). The pan- and core-genomes were used to perform gene accumulation curves using the statistical software R (R Core Team 2014). These curves describe the number of new genes (pan-genome) and genes in common (core-genome) obtained by adding a new genome to a previous set. The procedure was repeated 1,000 times by randomly modifying the order of integration of genomes in the analysis. The spectrum of frequencies (right) represents the number of genomes where the families of the pan-genome can be found, from 1 for strain-specific genes to 34 for core genes. Red indicates accessory genes and green the genes that are highly persistent in A. baumannii.
F<sc>ig</sc>. 2.—
Fig. 2.—
Comparisons of the pan-genome of A. baumannii computed with random samples of different size (boxplots) with those of the other species or genomic species. Each species, except A. baumannii, is only represented once, in the graph corresponding to the full number of available genomes for the taxa (e.g., nine genomes for A. lwoffii). The boxplots show the distribution of the size of the pan-genome of A. baumannii using random samples of K A. baumannii genomes (K = {2, 3, 4, 8, 9} genomes). Black dots correspond to pan-genomes of other species that are within the 25–75 percentiles of the distribution of the pan-genomes of A. baumannii, that is, these are pan-genomes approximately the size of A. baumannii given the same number of genomes. Red dots correspond to species with pan-genomes smaller than 75% of the A. baumannii pan-genomes (see supplementary table S5, Supplementary Material online, for full data).
F<sc>ig</sc>. 3.—
Fig. 3.—
Phylogeny of the Acinetobacter genus based on the alignment of the protein families of the core-genome (see Materials and Methods). Triangles mark groups of taxa that are from the same species or have more than 95% ANI values and therefore might be regarded as coming from the same species. The nodes in red have bootstrap supports higher than 95%. The tree was rooted using two outgroup genomes (see main text).
F<sc>ig</sc>. 4.—
Fig. 4.—
Analysis of the association between ANI and GRR (see Materials and Methods). The points in black correspond to the clades in triangles in figure 3. The points in gray correspond to comparisons between genomes that are closely related but not of the same species. We highlight three clades where some strains are closely related to the genomic species 13BJ-14TU, A. pittii, and A. calcoaceticus.
F<sc>ig</sc>. 5.—
Fig. 5.—
Analysis of the association between GRR and the phylogenetic distance. Points in black indicate comparisons between pairs of genomes of the same species/genomic species (triangles in fig. 3) and points in gray indicate the other pairs. The red line is a spline fit of the data. The inset shows the relation between the evolutionary distance and the probability that comparing two genomes will result in a GRR value higher than the average within-species GRR (red) and higher than the minimal within-species GRR (green).
F<sc>ig</sc>. 6.—
Fig. 6.—
Distribution of elements potentially related with genetic diversification in the genus. White indicates absence of the trait and black its presence. Genomes with many elements of a given type are indicated in red and those with few elements are indicated in yellow. Intermediate values are indicated in shades of orange. Black asterisks indicate complete genomes from GenBank.
F<sc>ig</sc>. 7.—
Fig. 7.—
Distribution of elements potentially related with genetic diversification in A. baumannii. White indicates absence of the trait and black its presence. Genomes with many elements of a given type are indicated in red and those with few elements are indicated in yellow. Intermediate values are indicated in shades of orange. Black asterisks indicate complete genomes from GenBank, blue asterisks indicate genomes sequenced at Pasteur Institute and at Walter Reed.
F<sc>ig</sc>. 8.—
Fig. 8.—
Molecular phylogeny of the Cas1 protein across the genus. Phylogenetic tree for the Cas1 proteins was performed using PhyML with the WAG model and a Gamma correction. Cluster of cas genes organization, the most common repeat sequence, and the number of repeat sequences in each genome are indicated on the right part of the figure. Black circles indicate incomplete CRISPR-Cas systems. The left inset shows the genomes sharing spacers, each edge corresponds to the spacer repertoire relatedness (see Materials and Methods). Each color corresponds to a given species.
F<sc>ig</sc>. 9.—
Fig. 9.—
Distribution of genes of the core-genome of A. baumannii presenting significant evidence of recombination using Phi (P < 0.05 after sequential Bonferroni correction) computed in sliding windows of 50 core genes. The dashed line indicates the average.
F<sc>ig</sc>. 10.—
Fig. 10.—
Distribution of integration/deletion hotspots along the core-genome of A. baumannii using gene orders of A. baumannii AYE strain as a reference (see Materials and Methods). The bars represent the number of different gene families in all the genomes found between two consecutive genes of the core-genome. The colors represent the diversity of these gene families, that is, the number of gene families divided by the number of genes found between two consecutive genes of the core-genome. If the number of genes is identical to the number of gene families (1, maximal diversity), then every genome has a different set of genes in the hotspot indicating many different insertions in the region. If the number of families equals the number of genes per genome (close to 1/33, minimal diversity), then most genomes have the same genes in the hotspot. This last scenario typically corresponds to strain-specific large deletions.

Similar articles

Cited by

References

    1. Ackermann HW, Brochu G, Emadi Konjin HP. Classification of Acinetobacter phages. Arch Virol. 1994;135:345–354. - PubMed
    1. Adams MD, et al. Comparative genome sequence analysis of multidrug-resistant Acinetobacter baumannii. J Bacteriol. 2008;190:8053–8064. - PMC - PubMed
    1. Altschul SF, et al. Gapped BLAST and PSI-BLAST: a new generation of protein database search programs. Nucleic Acids Res. 1997;25:3389–3402. - PMC - PubMed
    1. Alvarez-Perez S, Lievens B, Jacquemyn H, Herrera CM. Acinetobacter nectaris sp. nov. and Acinetobacter boissieri sp. nov., isolated from floral nectar of wild Mediterranean insect-pollinated plants. Int J Syst Evol Microbiol. 2013;63:1532–1539. - PubMed
    1. Antunes LC, Imperi F, Carattoli A, Visca P. Deciphering the multifactorial nature of Acinetobacter baumannii pathogenicity. PLoS One. 2011;6:e22674. - PMC - PubMed

Publication types

MeSH terms