. 2014 Dec;198(4):1395-404.
doi: 10.1534/genetics.114.171538. Epub 2014 Oct 13.

The distribution of pairwise genetic distances: a tool for investigating disease transmission

Affiliations

The distribution of pairwise genetic distances: a tool for investigating disease transmission

Colin J Worby et al. Genetics. 2014 Dec.

Abstract

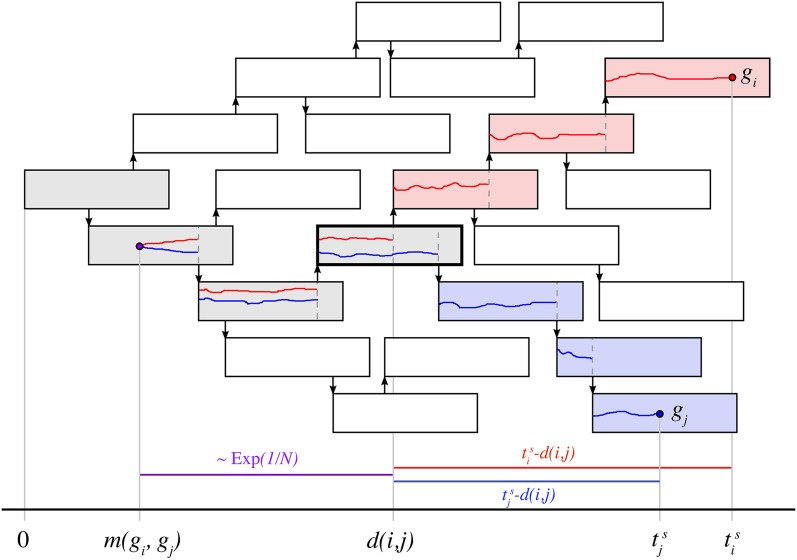
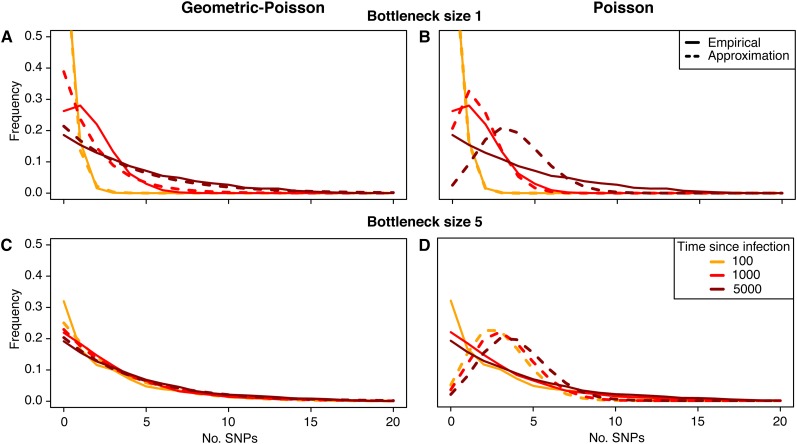
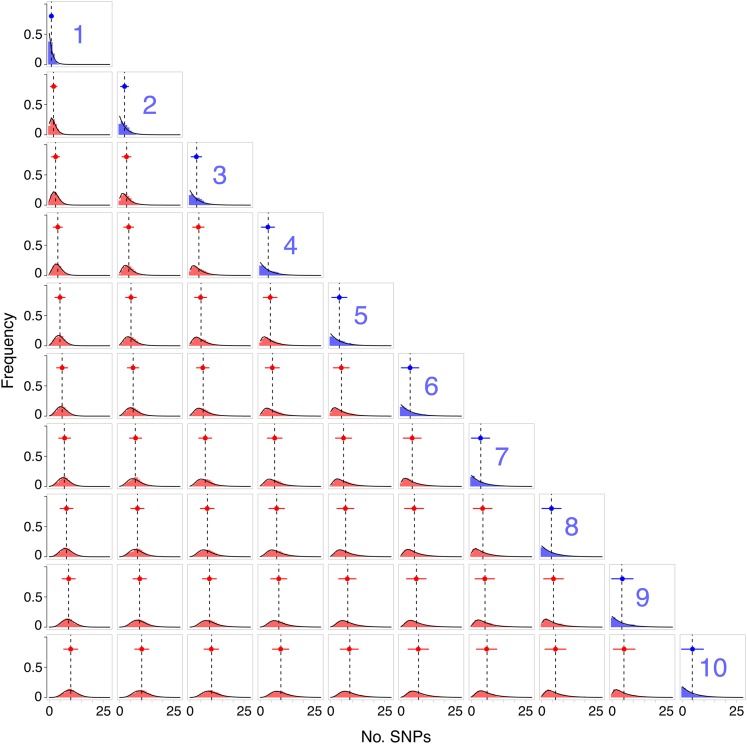
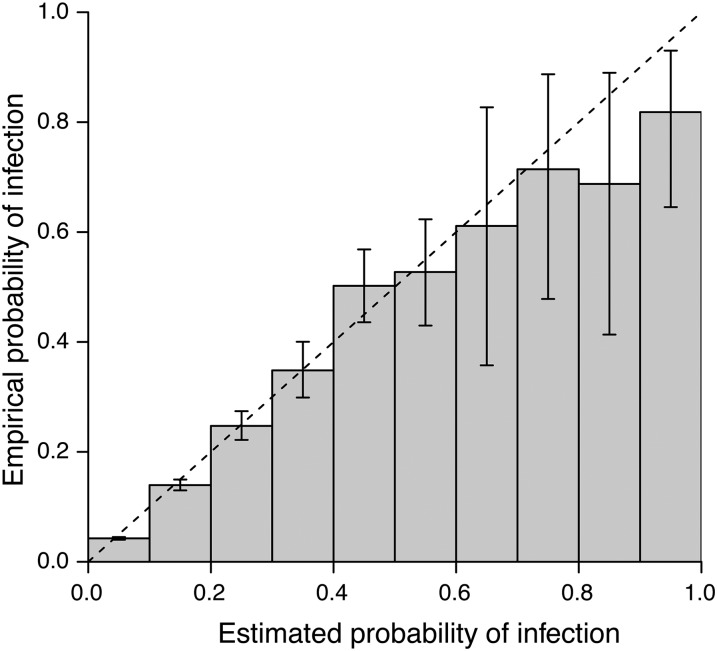
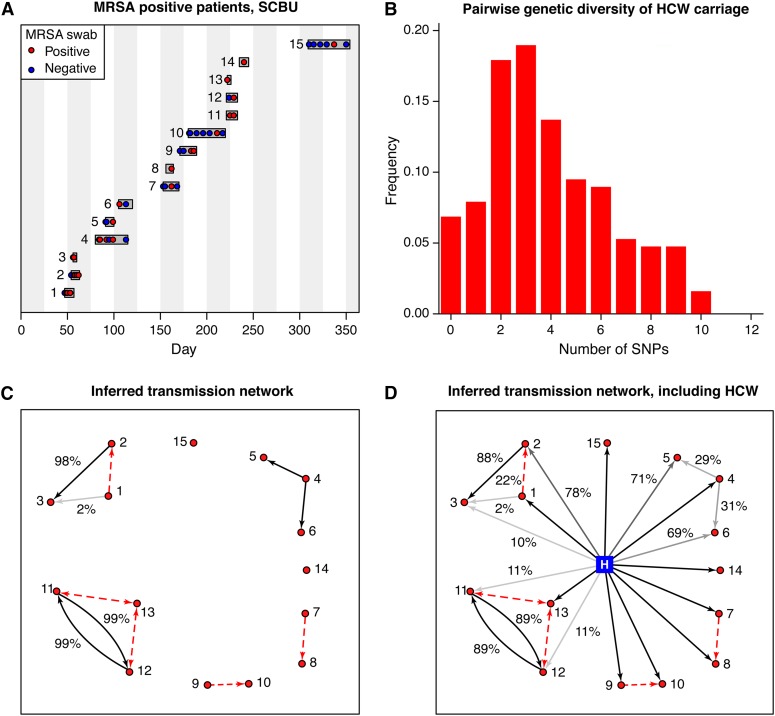
Whole-genome sequencing of pathogens has recently been used to investigate disease outbreaks and is likely to play a growing role in real-time epidemiological studies. Methods to analyze high-resolution genomic data in this context are still lacking, and inferring transmission dynamics from such data typically requires many assumptions. While recent studies have proposed methods to infer who infected whom based on genetic distance between isolates from different individuals, the link between epidemiological relationship and genetic distance is still not well understood. In this study, we investigated the distribution of pairwise genetic distances between samples taken from infected hosts during an outbreak. We proposed an analytically tractable approximation to this distribution, which provides a framework to evaluate the likelihood of particular transmission routes. Our method accounts for the transmission of a genetically diverse inoculum, a possibility overlooked in most analyses. We demonstrated that our approximation can provide a robust estimation of the posterior probability of transmission routes in an outbreak and may be used to rule out transmission events at a particular probability threshold. We applied our method to data collected during an outbreak of methicillin-resistant Staphylococcus aureus, ruling out several potential transmission links. Our study sheds light on the accumulation of mutations in a pathogen during an epidemic and provides tools to investigate transmission dynamics, avoiding the intensive computation necessary in many existing methods.

Keywords: epidemics; genetic distance; infectious diseases; transmission routes.


Figures

Figure 1
Figure 1
Two isolates sampled from infected cases during an outbreak. Each infected case is depicted by a rectangle, corresponding to its infectious period. Arrows denote transmission events. Samples gi (red circle) and gj (blue circle) are taken from persons i and j, respectively. The colored lines indicate the ancestry of each isolate back to its most recent common ancestor at time m(gi,gj). Hosts shaded in gray denote the shared ancestry sij, while blue and red denote the lineages of the genotypes gi and gj, respectively. The colored bars at the bottom of the diagram show the distinct time periods in which mutations may occur—between divergence and observation (blue and red) and from divergence to coalescence (purple), which is exponentially distributed, assuming a constant population N.
Figure 2
Figure 2
The empirical (solid lines) and estimated (dashed lines) distribution of genetic distances for sampling within host at specified times after infection. Both the geometric-Poisson approximation (A and C) and the simpler Poisson approximation (B and D) are shown. The infected host was infected by an inoculum of size 1 (A and B) and size 5 (C and D). The inoculum was a random sample from a bacterial population having evolved over a period of 5000 generations from an initial clonal population. Mutation rate is 0.002, and effective population size is 2000.
Figure 3
Figure 3
Genetic distance between each pair of cases in a transmission chain. The (i,j)th plot represents the empirical distribution of the genetic distance between samples taken from individuals i and j (red bars). The diagonal represents the within-host diversity for each of the 10 cases in the transmission chain (blue bars). Overlaid on each plot is the expected distribution (black line), based the geometric-Poisson approximation. The expected mean is marked with a dashed line, while the empirical mean and standard error bar are marked in red (blue for within host). The within-host equilibrium pathogen population was 10,000, with a bottleneck size of 5.
Figure 4
Figure 4
The empirical probability that a proposed transmission route is correct for a range of posterior probabilities calculated under the geometric-Poisson assumption. A total of 100 outbreaks were simulated and the posterior probability of direct transmission was calculated for every pair of infected individuals. Counts were collated into 10% probability bins and for each bin, the proportion of true transmission routes was calculated. Error bars depict the 95% exact binomial confidence interval.
Figure 5
Figure 5
Data and transmission route inference for the MRSA outbreak in the SCBU. (A) Patient episodes are shown as horizontal bars, with colored circles representing positive and negative swab results. (B) The observed pairwise genetic distances between the 20 sequenced isolates collected from the HCW. (C) Inferred transmission routes are shown, excluding the possibility of HCW–patient transmission. Red dashed lines indicate routes excluded at the 5% level. All temporally consistent transmission routes are shown. Posterior probability is 100% unless stated. (D) Inferred transmission routes, including the HCW as a potential source. The HCW is marked as a blue square.

References

    1. Balloux, F., 2010 Demographic influences on bacterial population structure, pp. 103–120 in Bacterial Population Genetics in Infectious Diseases, edited by D. A. Robinson, D. Falush, and E. J. Feil. John Wiley & Sons, New York.
    1. Chang-Li X., Hou-Kuhan T., Zhau-Hua S., Song-Sheng Q., Yao-Ting L., et al. , 1988. Microcalorimetric study of bacterial growth. Thermochim. Acta 123: 33–41.
    1. Cottam E. M., Thébaud G., Wadsworth J., Gloster J., Mansley L., et al. , 2008. Integrating genetic and epidemiological data to determine transmission pathways of foot-and-mouth disease virus. Proc. R. Soc. Ser. B 275: 887–895. - PMC - PubMed
    1. Dengremont E., Membré J. M., 1995. Statistical approach for comparison of the growth rates of five strains of Staphylococcus aureus. Appl. Environ. Microbiol. 61: 4389–4395. - PMC - PubMed
    1. Didelot X., Gardy J., Colijn C., 2014. Bayesian analysis of infectious disease transmission from whole genome sequence data. Mol. Biol. Evol. 31: 1869–1879. - PMC - PubMed

Publication types