. 2014 Oct 15;5(19):9362-81.
doi: 10.18632/oncotarget.2433.

The fatty acid synthase inhibitor triclosan: repurposing an anti-microbial agent for targeting prostate cancer

Affiliations

The fatty acid synthase inhibitor triclosan: repurposing an anti-microbial agent for targeting prostate cancer

Martin C Sadowski et al. Oncotarget. .

Abstract

Inhibition of FASN has emerged as a promising therapeutic target in cancer, and numerous inhibitors have been investigated. However, severe pharmacological limitations have challenged their clinical testing. The synthetic FASN inhibitor triclosan, which was initially developed as a topical antibacterial agent, is merely affected by these pharmacological limitations. Yet, little is known about its mechanism in inhibiting the growth of cancer cells. Here we compared the cellular and molecular effects of triclosan in a panel of eight malignant and non-malignant prostate cell lines to the well-known FASN inhibitors C75 and orlistat, which target different partial catalytic activities of FASN. Triclosan displayed a superior cytotoxic profile with a several-fold lower IC50 than C75 or orlistat. Structure-function analysis revealed that alcohol functionality of the parent phenol is critical for inhibitory action. Rescue experiments confirmed that end product starvation was a major cause of cytotoxicity. Importantly, triclosan, C75 and orlistat induced distinct changes to morphology, cell cycle, lipid content and the expression of key enzymes of lipid metabolism, demonstrating that inhibition of different partial catalytic activities of FASN activates different metabolic pathways. These finding combined with its well-documented pharmacological safety profile make triclosan a promising drug candidate for the treatment of prostate cancer.


Conflict of interest statement

Disclosure/Conflict of interest

The authors declare no conflicts of interest.

Figures
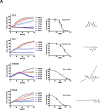
Figure 1
Figure 1. Inhibition of FASN by TCS causes cytotoxicity in PCa cells
(A) Proliferation as a function of cell confluence. LNCaP cells were treated with control (DMSO) or the indicated concentrations of inhibitors of de novo FA synthesis, and confluence was measured every 2 h for 96 h on an IncuCyte FLR system (left panel). IC50 values for treatment of LNCaP cells for 48 h were calculated by non-linear regression analysis (n=3 ±SD, middle panel). The structures of the lipogenic inhibitors are shown (right panel). (B) Representative images of A after 24 h of treatment with control (DMSO) or inhibitors (TCS 7.5 μM, C75 20 μM, orlistat 30 μM and TOFA 20 μM). (C) IC50 values for the indicated time points were calculated from the data in A (n=3 ±SD). (D) Western blot analysis of key lipogenic and energy sensing enzymes. LNCaP cells were treated for 24 h with control (DMSO) or the indicated inhibitors (TCS 10 μM, C75 20 μM, orlistat 20 μM and TOFA 10 μM), and protein lysates were probed with antibodies directed against the indicated proteins. As controls, LNCaP cells were treated with the AMPK activators metformin (2 mM) and AICAR (0.5 mM). For quantification, total protein levels were normalized relative to loading control (eIF2α). The level of protein phosphorylation was calculated relative to the normalized total amount of the respective protein. For better clarity, irrelevant lanes were removed from the image as indicated by the gaps. (E) LNCaP cells were treated with control (DMSO), 10 μM TCS or 20 μM C75 for the indicated times, and FASN expression was analyzed as in D. (F) Cytotoxicity of TCS and orlistat is mediated by FA starvation. LNCaP cells were treated with control (DMSO), 7.5 μM TCS, 40 μM C75, 10 μM orlistat, 5 μM palmitate (PA), or a combination of FASN inhibitor with PA (TCS+PA, C75+PA and orlistat+PA), and proliferation was measured for 96 h as described in A. (G) Representative images of F after 24 h of incubation.
Figure 2
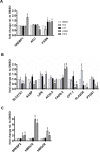
Figure 2. Inhibition of FA synthesis causes distinct effects on the expression of key genes involved in FA and cholesterol metabolism
(A) The expression of SREBP1, ACC and FASN was analyzed by qRT-PCR after treatment of LNCaP cells with TCS (5 μM), C75 (20 μM), orlistat (20 μM), and TOFA (10 μM) for 48 h (n=3, mean±SD, *p<0.05, **p<0.01, ***<0.001). (B) The indicated genes involved in various aspects of FA metabolism were analyzed as in A. (C) Effect of FA synthesis inhbitiors on the expression of key enzymes of cholesterol synthesis. SREBP2, HMGCS and HMGCR expression was analyzed as in A.
Figure 3
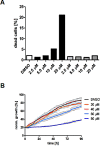
Figure 3. TCS causes G0/G1 cell cycle arrest and induces apoptosis in PCa cells
(A) LNCaP cells were treated with control (DMSO), 10 μM TCS, 40 μM C75 or 40 μM orlistat for 48 h, and cell cycle distribution was analyzed by flow cytometry and quantitated with ModFit LT. (B) PC-3 cells were treated with the indicated concentrations of TCS for 48 h and analyzed as in A. The results are representative of three independent experiments. (C) LNCaP cells were treated for 48 h with the indicated concentrations of TCS analyzed by flow cytometry. The percentage of dead cells with hypodiploid subG1 DNA content was quantitated with ModFit LT (n=3, mean±SD, *p<0.05, **p<0.01). (D) LNCaP cells were treated with 20 μM TCS for the indicated times and analyzed as in C. (E) LNCaP were treated with the indicated concentrations of TCS for 48 h, and apoptosis was analyzed by co-staining with Annexin V-FITC and PI. Early apoptotic cells (Annexin V-positive and PI-negative cells) were quantitated by flow cytometry (n=3, mean±SD, *p<0.05, **p<0.01). (F) LNCaP cells were treated as in E, and PARP cleavage was detected by immunoblotting. (G) FASN expression and lipogenesis were stimulated by treating androgen-deprived LNCaP cells (black bars) with 10 nM DHT (grey bars) or 5% FBS (white bars) prior incubation with the indicated concentrations of TCS for 48 h. The number of apoptotic cells was quantitated as in C. (H) Activation of AMPK decreases FASN expression and cellular lipid levels. Western blot analysis of FASN expression in LNCaP cells after treatment with 2 mM metformin for 48 h. As a loading control, protein levels of eIF2 were determined. Cellular lipid levels of LNCaP cells treated with 2 mM metformin or 0.5 mM AICAR for 48 h were measured by Nile Red staining and flow cytometry. LNCaP cells were incubated with the indicated concentrations of TCS for 48 h in the absence (white bars) or presence of metformin (black bars). Cell death was measured as in C (n=3, mean±SD, *p<0.05, **p<0.01). (I) LNCaP cells were treated with 5 μM TCS, 1-2 mM metformin or a combination of both compounds, and cell confluence was measured every 2 h for 72 h (top panel). The co-treatment of LNCaP cells was repeated with 7.5 μM TCS and 0.25-0.5 mM AICAR for 96 h (bottom panel).
Figure 4
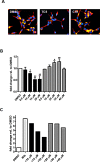
Figure 4. Triclosan reduces the lipid levels of LNCaP cells
(A) LNCaP cells treated with 10 μM TCS or 30 μM C75 for 48 h. Neutral (yellow) and polar lipids (red) were labelled with Nile Red and visualized by fluorescence microscopy. DNA was counterstained with DAPI (blue). (B) LNCaP cells were grown in 5% FBS before treatment with the indicated concentrations of TCS (black bars) or C75 (gray bars) for 48 h. After fixation, cellular lipids were stained with Nile Red, and fluorescence of neutral lipids was measured in a plate reader (n=3 ±SD, *p<0.05, **p<0.01). (C) FASN expression and lipogenesis were stimulated by treating androgen-deprived LNCaP cells (white bar) with 1 nM mibolerone (light gray bar) for 72 h prior incubation with the indicated concentrations of TCS (black bars) or C75 (dark gray bars) for 48 h. Samples were processed and measured as in B.
Figure 5
Figure 5. The hydroxyl group of triclosan is critical for its cytotoxic activity
(A) LNCaP cells were treated for 48 h with control (DMSO) or increasing concentrations of TCS (black bars) or its derivative TCSm (gray bars). Samples were analyzed by flow cytometry, and the percentage of apoptotic cells with hypodiploid subG1 DNA content was quantitated with ModFit LT. (B) LNCaP cells were treated with control (DMSO) or the indicated concentrations of TCSm, and confluence was measured every 2 h for 96 h (n=3 ±SD). (C) LNCaP cells were treated with increasing concentrations of the indicated TCS analogs and monitored by live cell imaging as described in B. Non-linear regression analysis of the dose response for 48 h is shown. (D) LNCaP cells were treated with control (DMSO) or the indicated concentrations of TCS15, and growth was measured as described in B (n=3 ±SD). (E) Western blot analysis of key lipogenic and energy sensing enzymes. LNCaP cells were treated for 24 h with control (DMSO) or 10 μM of the indicated TCS analogs, and protein lysates were probed with antibodies directed against the indicated proteins. For quantification, total protein levels were normalized relative to loading control (eIF2α). The level of protein phosphorylation was calculated relative to the normalized total protein amount.

Similar articles

Cited by

References

    1. Wakil SJ. Fatty acid synthase, a proficient multifunctional enzyme. Biochemistry. 1989;28(11):4523–4530. - PubMed
    1. Smith S, Witkowski A, Joshi AK. Structural and functional organization of the animal fatty acid synthase. Prog Lipid Res. 2003;42(4):289–317. - PubMed
    1. Brusselmans K, Swinnen J. The Lipogenic Switch in Cancer. Mitochondria and Cancer: Springer New York) 2009:39–59.
    1. Lupu R, Menendez JA. Pharmacological inhibitors of Fatty Acid Synthase (FASN)--catalyzed endogenous fatty acid biogenesis: a new family of anti-cancer agents? Curr Pharm Biotechnol. 2006;7(6):483–493. - PubMed
    1. Rendina AR, Cheng D. Characterization of the inactivation of rat fatty acid synthase by C75: inhibition of partial reactions and protection by substrates. Biochem J. 2005;388(Pt 3):895–903. - PMC - PubMed

Publication types

MeSH terms