. 2014 Oct;16 Suppl 7(Suppl 7):vii24-35.
doi: 10.1093/neuonc/nou286.

Impact of imaging measurements on response assessment in glioblastoma clinical trials

Affiliations

Impact of imaging measurements on response assessment in glioblastoma clinical trials

David A Reardon et al. Neuro Oncol. 2014 Oct.

Abstract

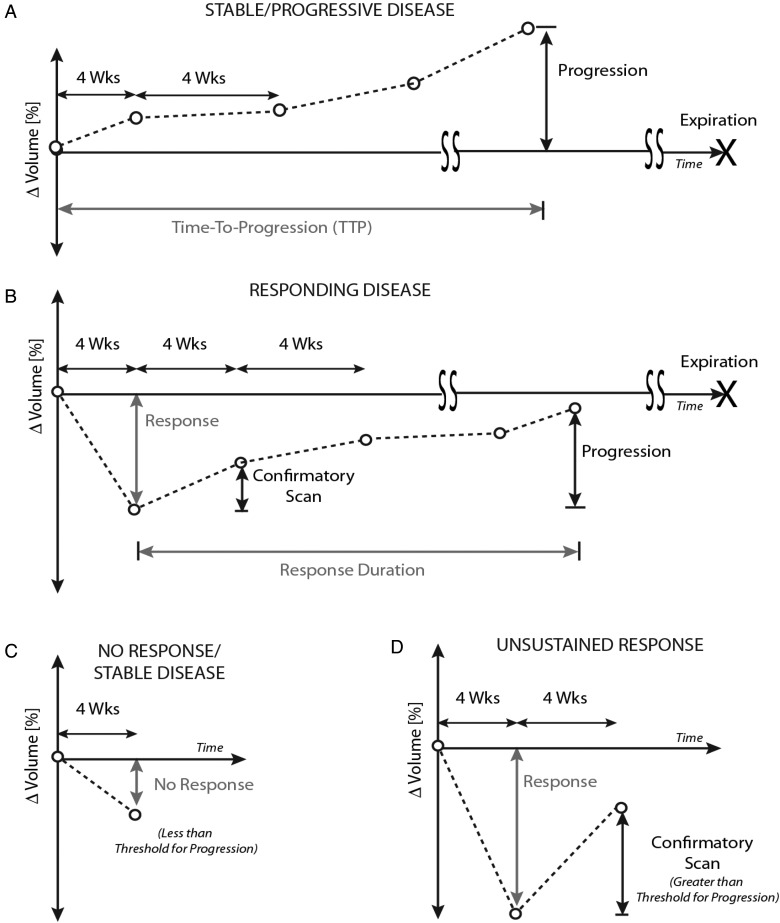
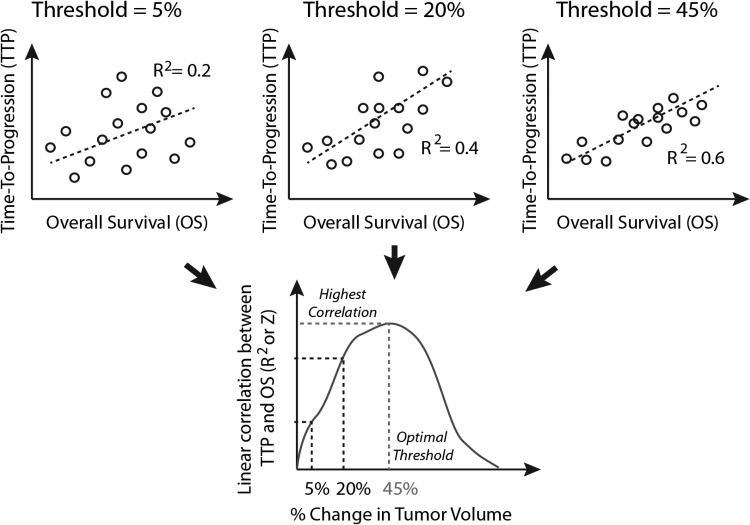
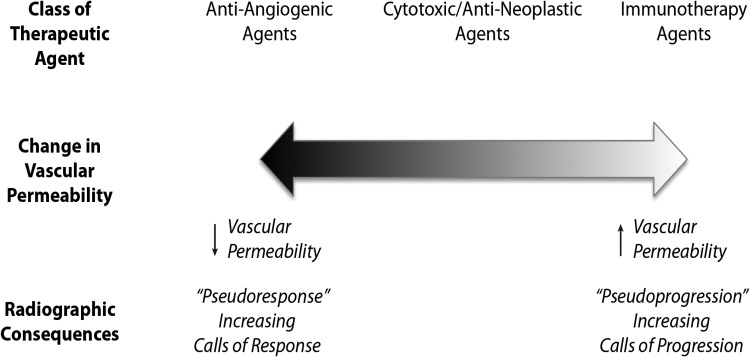
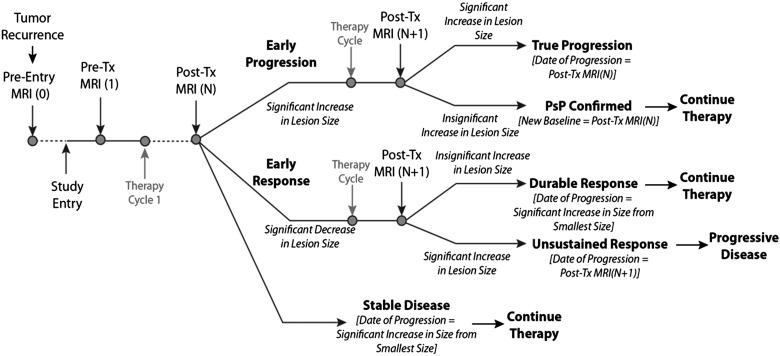
We provide historical and scientific guidance on imaging response assessment for incorporation into clinical trials to stimulate effective and expedited drug development for recurrent glioblastoma by addressing 3 fundamental questions: (i) What is the current validation status of imaging response assessment, and when are we confident assessing response using today's technology? (ii) What imaging technology and/or response assessment paradigms can be validated and implemented soon, and how will these technologies provide benefit? (iii) Which imaging technologies need extensive testing, and how can they be prospectively validated? Assessment of T1 +/- contrast, T2/FLAIR, diffusion, and perfusion-imaging sequences are routine and provide important insight into underlying tumor activity. Nonetheless, utility of these data within and across patients, as well as across institutions, are limited by challenges in quantifying measurements accurately and lack of consistent and standardized image acquisition parameters. Currently, there exists a critical need to generate guidelines optimizing and standardizing MRI sequences for neuro-oncology patients. Additionally, more accurate differentiation of confounding factors (pseudoprogression or pseudoresponse) may be valuable. Although promising, diffusion MRI, perfusion MRI, MR spectroscopy, and amino acid PET require extensive standardization and validation. Finally, additional techniques to enhance response assessment, such as digital T1 subtraction maps, warrant further investigation.

Keywords: MRI; clinical trials; glioblastoma; imaging; response assessment.


Figures

Fig. 1.
Fig. 1.
Definition of tumor response to therapy. (A) Definition of time-to-progression (TTP) and/or progression-free survival (PFS). Tumors that are stable or not responding must show an increase in enhancement beyond a specific threshold from baseline to be deemed “progression”. The time from initiation of drug to progression is defined as TTP. (B) For “responding disease”, tumors must show a decrease in more than a specific threshold of change in size at some point during their therapy. This must be verified with a confirmatory scan 4 weeks following the scan with the largest response. This confirmation scan must not show tumor growth more than the threshold of progression, as defined from the smallest volume. Progression is then defined when the tumor grows to more than the threshold of change in size compared with the smallest volume. The “response duration” is defined as the time between the smallest volume, determined to be beyond the response threshold, and the time of progression. Landmark overall survival (OS) is determined from the time between the smallest volume, determined to be beyond the response threshold, and the time of expiration. (C) An example of “no response”, in which the tumor does not shrink beyond the optimal threshold. (D) Another example of “no response” is when the tumor shrinks beyond the optimal threshold, but the confirmatory scan increases more than the threshold defined for progression compared with the smallest volume. This is an unsustained response, and thus is not considered a responder.
Fig. 2.
Fig. 2.
Example diagram depicting the determination of “optimal”, clinically meaningful thresholds for tumor progression. As the threshold for change in enhancing tumor size is adjusted from 0% to 100%, each individual patient's time-to-progression (TTP) and other imaging endpoint time-to-event measures will change accordingly. The optimal threshold for change could be estimated by finding the threshold necessary to maximize the correlation coefficient (R2), or z-transformed correlation coefficient, between this imaging endpoint time to event and an objective measure of clinical benefit (eg, overall survival).
Fig. 3.
Fig. 3.
Broad classes of current therapeutic agents, their effect on vascular permeability, and the radiographic consequences.
Fig. 4.
Fig. 4.
Modified response assessment rubric for management of both pseudoprogression and pseudoresponse in recurrent GBM clinical trials.

References

    1. Ballman KV, Buckner JC, Brown PD, et al. The relationship between six-month progression-free survival and 12-month overall survival end points for phase II trials in patients with glioblastoma multiforme. Neuro Oncol. 2007;9(1):29–38. - PMC - PubMed
    1. Wu W, Lamborn KR, Buckner JC, et al. Joint NCCTG and NABTC prognostic factors analysis for high-grade recurrent glioma. Neuro Oncol. 2010;12(2):164–172. - PMC - PubMed
    1. Lamborn KR, Yung WK, Chang SM, et al. Progression-free survival: an important end point in evaluating therapy for recurrent high-grade gliomas. Neuro Oncol. 2008;10(2):162–170. - PMC - PubMed
    1. Han K, Ren M, Wick W, et al. Progression-free survival as a surrogate endpoint for overall survival in glioblastoma: a literature-based meta-analysis from 91 trials. Neuro Oncol. 2014;16(5):696–706. - PMC - PubMed
    1. Blankenberg FG, Teplitz RL, Ellis W, et al. The influence of volumetric tumor doubling time, DNA ploidy, and histologic grade on the survival of patients with intracranial astrocytomas. AJNR Am J Neuroradiol. 1995;16(5):1001–1012. - PMC - PubMed

Publication types

MeSH terms