. 2015 Mar;26(3):553-64.
doi: 10.1681/ASN.2013090984. Epub 2014 Oct 13.

β-catenin links von Hippel-Lindau to aurora kinase A and loss of primary cilia in renal cell carcinoma

Affiliations

β-catenin links von Hippel-Lindau to aurora kinase A and loss of primary cilia in renal cell carcinoma

Ruhee Dere et al. J Am Soc Nephrol. 2015 Mar.

Abstract

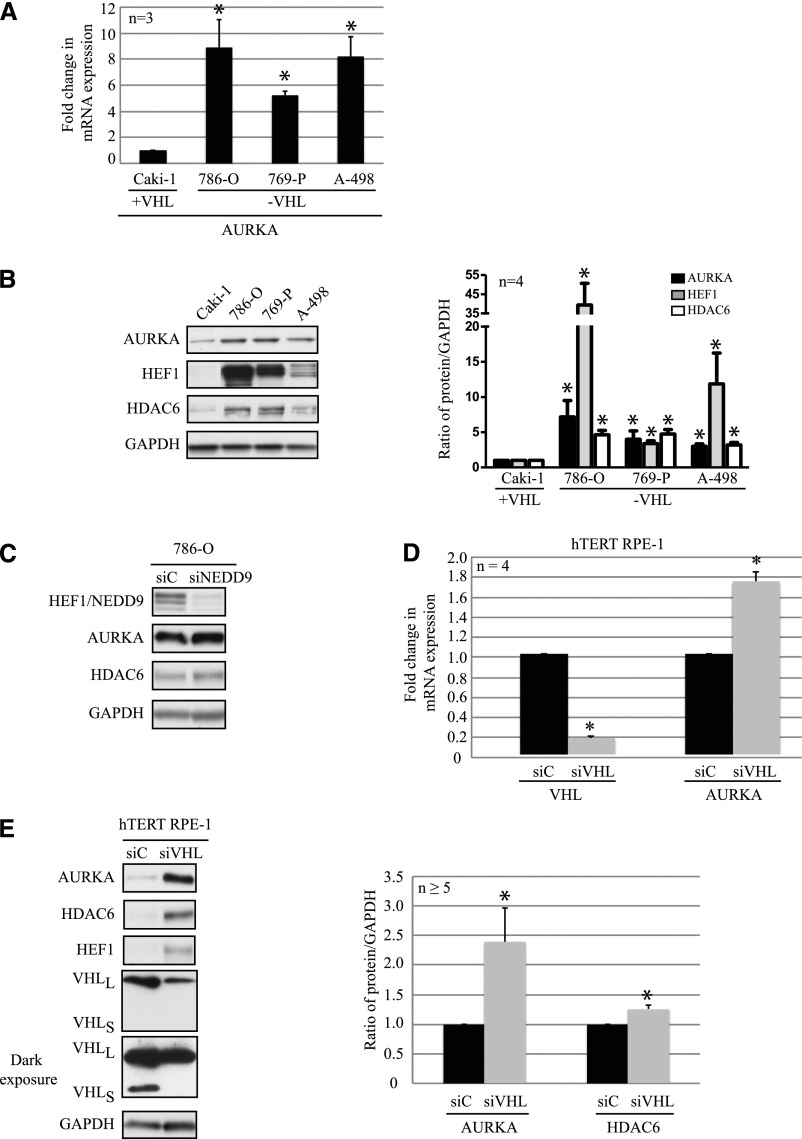
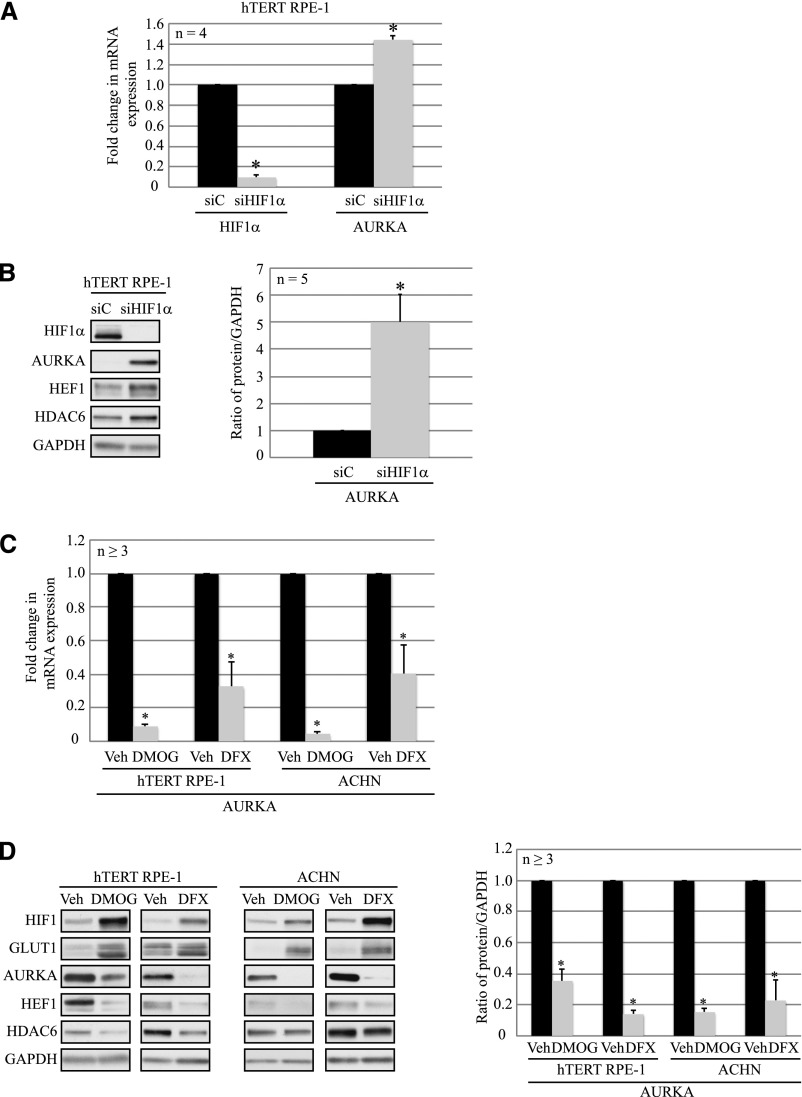
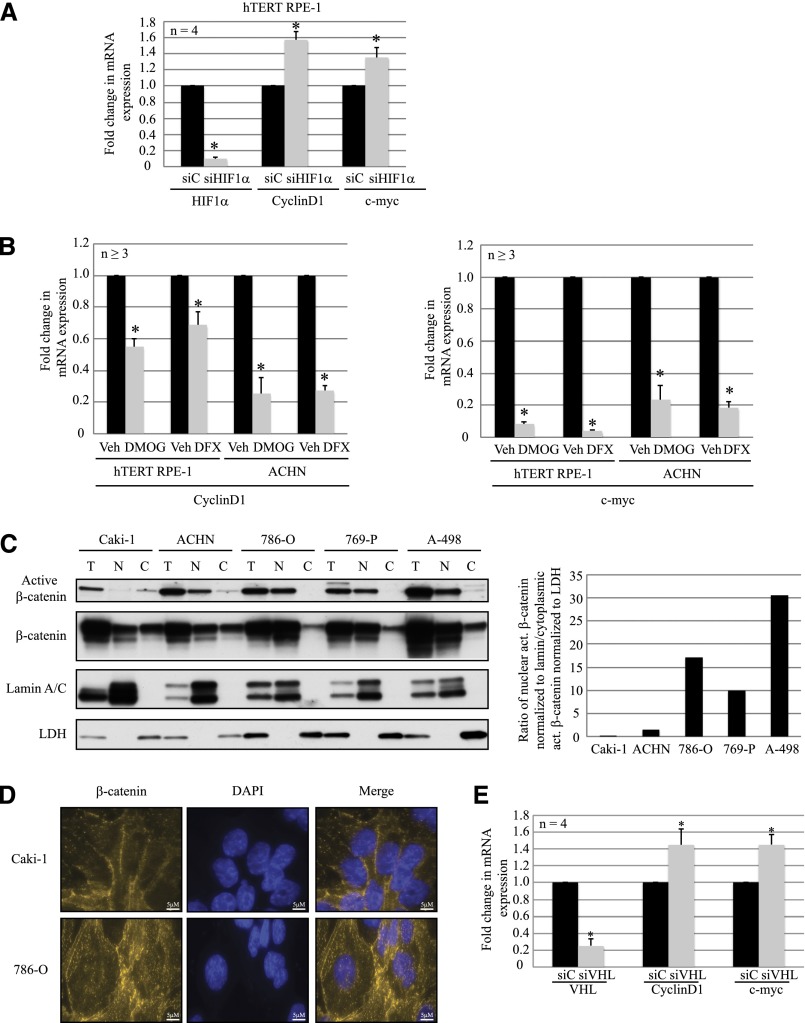
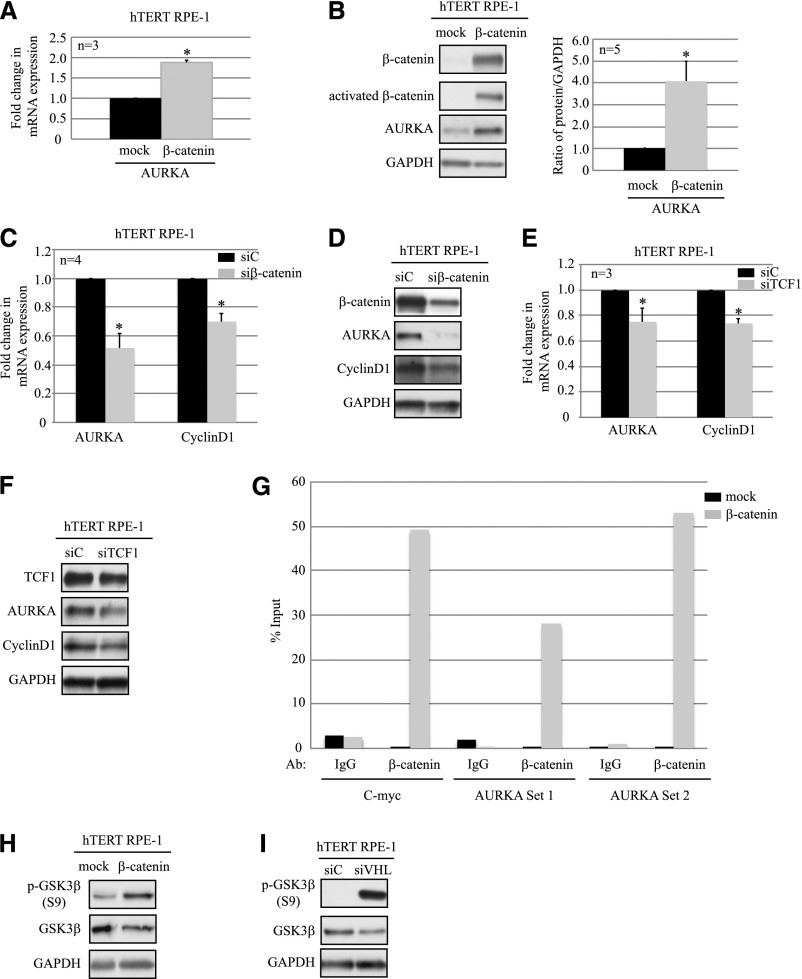
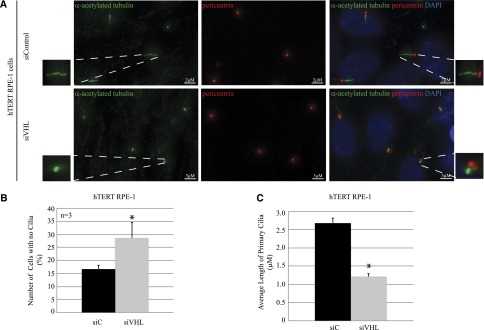
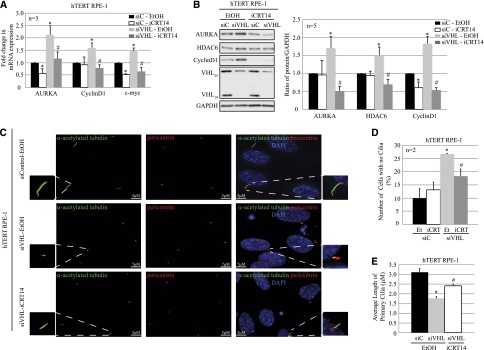
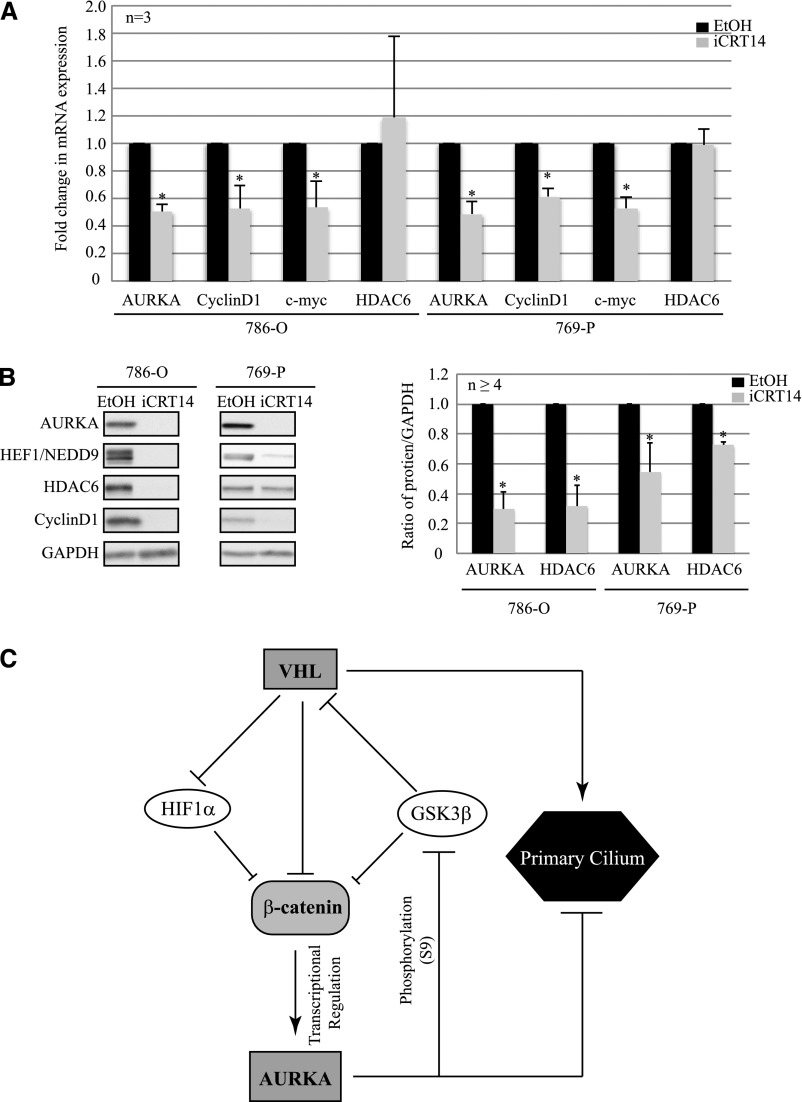
von Hippel-Lindau (VHL) gene mutations are associated with clear cell renal cell carcinoma (ccRCC). A hallmark of ccRCC is loss of the primary cilium. Loss of this key organelle in ccRCC is caused by loss of VHL and associated with increased Aurora kinase A (AURKA) and histone deacetylase 6 (HDAC6) activities, which drive disassembly of the primary cilium. However, the underlying mechanism by which VHL loss increases AURKA levels has not been clearly elucidated, although it has been suggested that hypoxia-inducible factor-1α (HIF-1α) mediates increased AURKA expression in VHL-null cells. By contrast, we found that elevated AURKA expression is not increased by HIF-1α, suggesting an alternate mechanism for AURKA dysregulation in VHL-null cells. We report here that AURKA expression is driven by β-catenin transcription in VHL-null cells. In a panel of RCC cell lines, we observed nuclear accumulation of β-catenin and increased AURKA signaling to HDAC6. Moreover, HIF-1α inhibited AURKA expression by inhibiting β-catenin transcription. VHL knockdown activated β-catenin and elevated AURKA expression, decreased primary cilia formation, and caused significant shortening of cilia length in cells that did form cilia. The β-catenin responsive transcription inhibitor iCRT14 reduced AURKA levels and rescued ciliary defects, inducing a significant increase in primary cilia formation in VHL-deficient cells. These data define a role for β-catenin in regulating AURKA and formation of primary cilia in the setting of VHL deficiency, opening new avenues for treatment with β-catenin inhibitors to rescue ciliogenesis in ccRCC.

Keywords: cell signaling; kidney cancer; renal cell biology.


Figures

Figure 1.
Figure 1.
AURKA expression and signaling to HDAC6 is elevated in RCC. (A) RT-PCR analyses of AURKA mRNA expression in VHL-proficient (Caki-1) or VHL-deficient (786-O, 769-P, and A-498) RCC cells, normalized to Caki-1 (P<0.01). (B) Lysates from VHL-proficient (Caki-1) or VHL-deficient (786-O, 769-P, and A-498) RCC cells are probed with the indicated antibodies (left). Densitometric analyses of protein expression normalized to GAPDH expression from four independent experiments, plotted as graphs showing AURKA (black bars), HEF1 (gray bars), and HDAC6 (white bars) expression compared with expression in the Caki-1 cells (P<0.05). (C) Lysates from 786-O cells expressing the siC nontargeting scrambled control or siNEDD9 are probed with NEDD9, AURKA, HDAC6, and GAPDH antibodies. (D) RT-PCR analyses of hTERT RPE-1 cells transfected with a nontargeting control siC (black bars) or siVHL (gray bars) showing fold-changes in VHL and AURKA transcript levels as indicated (P<0.01). (E) Lysates from normal hTERT RPE-1 cells expressing siC or siVHL are immunoblotted for the indicated antibodies. Densitometric analyses from at least five independent experiments are shown as graphs indicating levels of AURKA and HDAC6 in cells expressing siC (black bars) or siVHL (gray bars) (P<0.01). *Statistically significant differences. siC, scrambled nontargeting control; siVHL, VHL-specific siRNA.
Figure 2.
Figure 2.
HIF-1α inhibits AURKA expression in epithelial cells. (A) mRNA expression of HIF-1α and AURKA from hTERT RPE-1 cells transfected with the siC nontargeting (scrambled) control (black bars) or siHIF-1α (gray bars) (P<0.01). (B) Lysates prepared from hTERT RPE-1 cells transfected with siC (black bars) or siHIF-1α (gray bars) are analyzed by immunoblotting with the indicated antibodies. Densitometric analyses from five independent experiments showing AURKA protein expression normalized to GAPDH are denoted in the graph (P<0.01). (C) RT-PCR analyses of AURKA mRNA from hTERT RPE-1 and ACHN cells treated with water (vehicle; black bars), DMOG (1 mM; gray bars), or defroxamine (250 μM; gray bars) as indicated (P<0.01). (D) Cell lysates from hTERT RPE-1 and ACHN cells treated with vehicle (black bars), DMOG (1 mM; gray bars), or DFX (250 μM; gray bars) are immunoblotted with the indicated antibodies. Densitometric analyses showing protein expression normalized to GAPDH from at least three independent replicates are shown in the graph (right) (P<0.01). *Statistically significant differences. siC, scrambled nontargeting control; siHIF-1α, HIF-1α–specific siRNA; Veh, vehicle; DMOG, dimethyloxalylglycine; DFX, defroxamine; GLUT1, glucose transporter 1.
Figure 3.
Figure 3.
Loss of HIF-1α and VHL promotes activation of β-catenin. (A) RT-PCR analyses of hTERT RPE-1 cells expressing nontargeting control siC (black bars) or siHIF-1α (gray bars), showing mRNA levels of HIF-1α, CyclinD1, and c-myc (P<0.01). (B) RT-PCR analyses showing CyclinD1 (left) and c-myc (right) transcript levels in hTERT RPE-1 and ACHN cells treated with vehicle (black bars) or hypoxia mimetics DMOG (1 mM; gray bars) or DFX (250 μM; gray bars ) as indicated (P<0.01). (C) Subcellular fractionation of VHL-proficient (Caki-1 and ACHN) and VHL-deficient (786-O, 769-P, and A-498) RCC cells, immunoblotted with the indicated antibodies (Lamin A/C, nuclear marker; LDH, cytoplasmic marker; T, whole cell extract; N, nuclear; C, cytoplasmic). Densitometric analyses (right) of the blots (left) indicating a ratio of activated β-catenin in the nuclear fraction (normalized to nuclear marker Lamin A/C) to the levels in the cytoplasmic fraction (normalized to cytoplasmic marker LDH). (D) Immunofluorescence staining of Caki-1 and 786-O cells using β-catenin (yellow) antibody. The nuclei are counterstained with DAPI (blue). (E) RT-PCR analyses of hTERT RPE-1 cells expressing nontargeting control siC (black bars) or siVHL (gray bars), showing mRNA expression levels of VHL, CyclinD1, and c-myc (P<0.01). *Statistically significant differences. siC, scrambled nontargeting control; siHIF-1α, HIF-1α-specific siRNA; Veh, vehicle; DMOG, dimethyloxalylglycine; DFX, defroxamine; T, whole cell extract; N, nuclear; C, cytoplasmic; LDH, lactate dehydrogenase; DAPI, 4′,6-diamidino-2-phenylindole; siVHL, VHL-specific siRNA. Bar, 5 μM.
Figure 4.
Figure 4.
β-catenin drives AURKA expression. (A) RT-PCR analyses showing AURKA mRNA levels in hTERT RPE-1 cells overexpressing β-catenin construct (gray bar) or a mock transfection control (black bar) (P<0.01). (B) Lysates from hTERT RPE-1 cells overexpressing β-catenin immunoblotted for the indicated antibodies (left), and graphical representation of densitometric analyses from five independent replicates (right) (P<0.01). Black bars indicate mock, whereas gray bars indicate β-catenin overexpression. (C) mRNA expression of AURKA and CyclinD1 from hTERT RPE-1 cells transfected with a siC nontargeting (scrambled) control (black bars) or siβ-catenin (gray bars) (P<0.01). (D) Representative blots of lysates prepared from hTERT RPE-1 cells transfected with siC or siβ-catenin are analyzed by immunoblotting with the indicated antibodies (n=4). (E) mRNA expression of AURKA and CyclinD1 from hTERT RPE-1 cells transfected with a siC nontargeting (scrambled) control (black bars) or siTCF-1 (gray bars) (P<0.05). (F) Representative blots of lysates prepared from hTERT RPE-1 cells transfected with siC or siTCF-1 are analyzed by immunoblotting with the indicated antibodies (n=3). (G) ChIP assay in hTERT RPE-1 cells transfected with a β-catenin construct or a mock transfection control demonstrating direct binding of β-catenin to the AURKA gene promoter. ChIP is performed with either IgG or β-catenin antibodies followed by RT-PCR for using primers for the regions as indicated. (H) Representative immunoblots from lysates generated by overexpressing β-catenin in hTERT RPE-1 cells probed with phospho-GSK3β (S9), GSK3β, and GAPDH antibodies. (I) Immunoblot analyses of hTERT RPE-1 cells with VHL knockdown (siVHL) probed with the indicated antibodies. GAPDH serves as the loading control. *Statistically significant differences. siC, scrambled nontargeting control; siβ-catenin, β-catenin–specific siRNA; siTCF1, T-cell factor 1–specific siRNA; TCF1, T-cell factor 1; Ab, antibody; siVHL, VHL-specific siRNA.
Figure 5.
Figure 5.
Loss of VHL results in shortening of primary cilia. (A) Immunofluorescence staining of hTERT RPE-1 cells expressing siC or siVHL using acetylated α-tubulin (cilia marker, green) and pericentrin (basal body marker, red). The nuclei are counterstained with DAPI (blue). Enlarged panels show higher magnification of primary cilia. (B) Immunofluorescence images are analyzed using Imaris software to quantitate the number of cells that failed to form primary cilia from >100 individual hTERT RPE-1 cells transfected with siC (black bars) or siVHL (gray bars). Data from three independent replicates (each >100 cells) are denoted as a percentage of cells without cilia (P<0.01). (C) Immunofluorescence images are analyzed using Imaris software to measure the length of the primary cilia from >150 individual hTERT RPE-1 cells transfected with siC (black bars) or siVHL (gray bars). A representative experiment is shown (P=3.4×10⁻²²). *Statistically significant differences. siC, scrambled nontargeting control; siVHL, VHL-specific siRNA; DAPI, 4′,6-diamidino-2-phenylindole. Bar, 2 μM for siC in A; 3 μM for siVHL in A.
Figure 6.
Figure 6.
Inhibition of β-catenin responsive transcription rescues the ciliary defect in epithelial cells after acute loss of VHL. (A) RT-PCR analyses of hTERT RPE-1 cells expressing siC (scrambled) treated with vehicle (EtOH; black bars) or iCRT14 (15 μM; white bars), and siVHL treated with either vehicle (EtOH; light gray bars) or iCRT14 (15 μM, dark gray bars) showing AURKA, CyclinD1, and c-myc mRNA transcript levels as indicated (P<0.05). (B) Immunoblot analyses from hTERT RPE-1 cells transfected with either siC treated with EtOH (black bars) or iCRT14 (15 μM; white bars) and siVHL treated with EtOH (vehicle; light gray bars) or iCRT14 (15 μM; dark gray bars) probed with the indicated antibodies (left). The graph represents the densitometric analyses from five independent replicates showing protein expression normalized to GAPDH (loading control; right) (P<0.05). (C) Immunofluorescence staining of hTERT RPE-1 cells expressing siC or siVHL, treated with EtOH (vehicle) or iCRT14 (15 μM), using acetylated α-tubulin (cilia marker, green) and pericentrin (basal body marker, red). The nuclei are counterstained with DAPI (blue). A single primary cilium is shown in the enlarged panels. (D) Immunofluorescence images are analyzed using Imaris software to quantitate the number of cells that failed to make primary cilia from >100 individual hTERT RPE-1 cells transfected with siC treated with EtOH (black bars) or iCRT14 (white bars) and siVHL treated with EtOH (light gray bars) or iCRT14 (dark gray bars). Data from three independent replicates (each >100 cells) are denoted as a percentage of cells without cilia (P<0.01). (E) Immunofluorescence images are analyzed using Imaris software to measure the length of the primary cilia from >150 individual hTERT RPE-1 cells transfected with siC treated with EtOH (black bars) or siVHL treated with EtOH (gray bars) or iCRT14 (white bars). A representative experiment is shown (P<0.01). *Statistically significant differences compared with siC-EtOH; #Statistically significant differences between siVHL-EtOH and siVHL-iCRT14 treatment groups. siC, scrambled nontargeting control; siVHL, VHL-specific siRNA; DAPI, 4′,6-diamidino-2-phenylindole. Bar, 5 μM for siC-EtOH and siVHL-iCRT14 in C; 7 μM for siVHL-EtOH in C.
Figure 7.
Figure 7.
iCRT14 rescues aberrant AURKA signaling in RCC cell lines. (A) RT-PCR analyses showing AURKA, CyclinD1, c-myc, and HDAC6 mRNA expression in VHL-null, 786-O, and 769-P RCC cell lines treated with vehicle (EtOH; black bars) or iCRT14 (15 μM; gray bars) (P<0.05). (B) Immunoblot analyses from 786-O and 769-P RCC cells treated with EtOH (black bars) or iCRT14 (gray bars), probed with the indicated antibodies (left). The graph (right) represents densitometric analyses from at least four independent replicates showing levels of protein expression normalized to GAPDH expression (loading control) (P<0.05). (C) Model for β-catenin regulation of AURKA in VHL-deficient cells. *Statistically significant differences.

Similar articles

Cited by

References

    1. Bausch B, Jilg C, Gläsker S, Vortmeyer A, Lützen N, Anton A, Eng C, Neumann HP: Renal cancer in von Hippel-Lindau disease and related syndromes. Nat Rev Nephrol 9: 529–538, 2013 - PubMed
    1. Valladares Ayerbes M, Aparicio Gallego G, Díaz Prado S, Jiménez Fonseca P, García Campelo R, Antón Aparicio LM: Origin of renal cell carcinomas. Clin Transl Oncol 10: 697–712, 2008 - PubMed
    1. Stebbins CE, Kaelin WG, Jr, Pavletich NP: Structure of the VHL-ElonginC-ElonginB complex: Implications for VHL tumor suppressor function. Science 284: 455–461, 1999 - PubMed
    1. Haase VH: Renal cancer: Oxygen meets metabolism. Exp Cell Res 318: 1057–1067, 2012 - PMC - PubMed
    1. Li L, Kaelin WG, Jr: New insights into the biology of renal cell carcinoma. Hematol Oncol Clin North Am 25: 667–686, 2011 - PMC - PubMed

Publication types

MeSH terms