

Modeling particle number concentrations along Interstate 10 in El Paso, Texas
- PMID: 25313294
- PMCID: PMC4192655
- DOI: 10.1016/j.atmosenv.2014.09.030
Modeling particle number concentrations along Interstate 10 in El Paso, Texas
Abstract
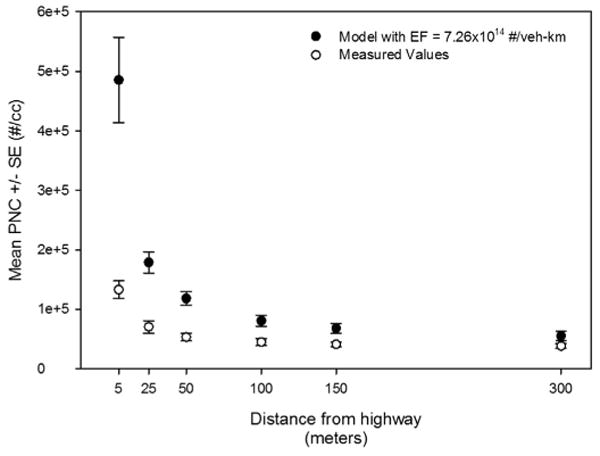
Annual average daily particle number concentrations around a highway were estimated with an atmospheric dispersion model and a land use regression model. The dispersion model was used to estimate particle concentrations along Interstate 10 at 98 locations within El Paso, Texas. This model employed annual averaged wind speed and annual average daily traffic counts as inputs. A land use regression model with vehicle kilometers traveled as the predictor variable was used to estimate local background concentrations away from the highway to adjust the near-highway concentration estimates. Estimated particle number concentrations ranged between 9.8 × 10³ particles/cc and 1.3 × 10⁵ particles/cc, and averaged 2.5 × 10⁴ particles/cc (SE 421.0). Estimates were compared against values measured at seven sites located along I10 throughout the region. The average fractional error was 6% and ranged between -1% and -13% across sites. The largest bias of -13% was observed at a semi-rural site where traffic was lowest. The average bias amongst urban sites was 5%. The accuracy of the estimates depended primarily on the emission factor and the adjustment to local background conditions. An emission factor of 1.63 × 10¹⁴ particles/veh-km was based on a value proposed in the literature and adjusted with local measurements. The integration of the two modeling techniques ensured that the particle number concentrations estimates captured the impact of traffic along both the highway and arterial roadways. The performance and economical aspects of the two modeling techniques used in this study shows that producing particle concentration surfaces along major roadways would be feasible in urban regions where traffic and meteorological data are readily available.
Keywords: Dispersion model; Land use regression; US-Mexico border; Ultrafine.
Figures


References
-
- Babyak M. What you see may not be what you get: A brief, nontechnical introduction to overfitting in regression-type models. Psychosom Med. 2004;66:411–421. - PubMed
-
- Chalupa DC, Morrow PE, Oberdörster G, Utell MJ, Frampton MW. Ultrafine particle deposition in subjects with Asthma. Environ Health Perspect. 2004:1–4. http://dx.doi.org/10.1289/ehp.6851. - DOI - PMC - PubMed
-
- Daigle C, Chalupa D, Gibb F, Morrow P, Oberdörster G, Utell M, Frampton M. Ultrafine particle deposition in humans during rest and exercise. Inhal Toxicol. 2003;15:539–552. - PubMed
-
- Green S. How many subjects does it take to do a regression analysis? Multivar behav res. 1991;26:499–510. - PubMed
-
- Hoek G, Beelen R, de Hoogh K, Vienneau D, Gulliver J, Fischer P, Briggs D. A review of land-use regression models to assess spatial variation of outdoor air pollution. Atmos Environ. 2008;42:7561–7578. http://dx.doi.org/10.1016/j.atmosenv.2008.05.057. - DOI
Grants and funding
LinkOut - more resources
Full Text Sources
Other Literature Sources