. 2014 Oct 2;10(1):31.
doi: 10.1186/1746-4811-10-31. eCollection 2014.

Bacterially produced Pt-GFP as ratiometric dual-excitation sensor for in planta mapping of leaf apoplastic pH in intact Avena sativa and Vicia faba

Affiliations

Bacterially produced Pt-GFP as ratiometric dual-excitation sensor for in planta mapping of leaf apoplastic pH in intact Avena sativa and Vicia faba

Christoph-Martin Geilfus et al. Plant Methods. .

Abstract

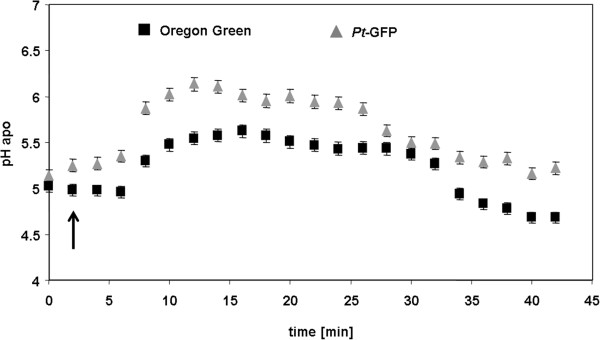
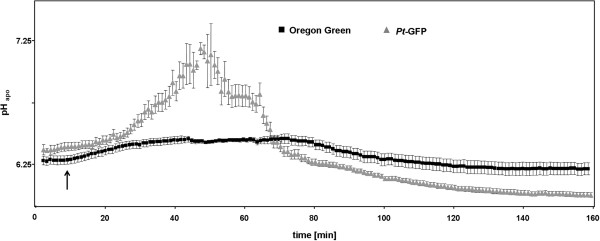
Background: Ratiometric analysis with H(+)-sensitive fluorescent sensors is a suitable approach for monitoring apoplastic pH dynamics. For the acidic range, the acidotropic dual-excitation dye Oregon Green 488 is an excellent pH sensor. Long lasting (hours) recordings of apoplastic pH in the near neutral range, however, are more problematic because suitable pH indicators that combine a good pH responsiveness at a near neutral pH with a high photostability are lacking. The fluorescent pH reporter protein from Ptilosarcus gurneyi (Pt-GFP) comprises both properties. But, as a genetically encoded indicator and expressed by the plant itself, it can be used almost exclusively in readily transformed plants. In this study we present a novel approach and use purified recombinant indicators for measuring ion concentrations in the apoplast of crop plants such as Vicia faba L. and Avena sativa L.

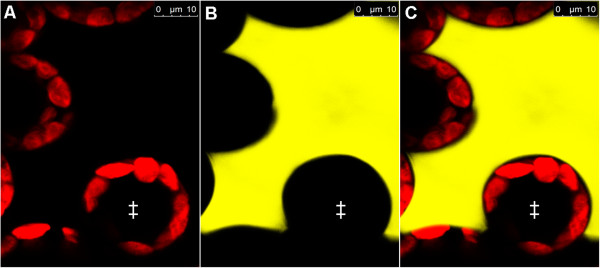
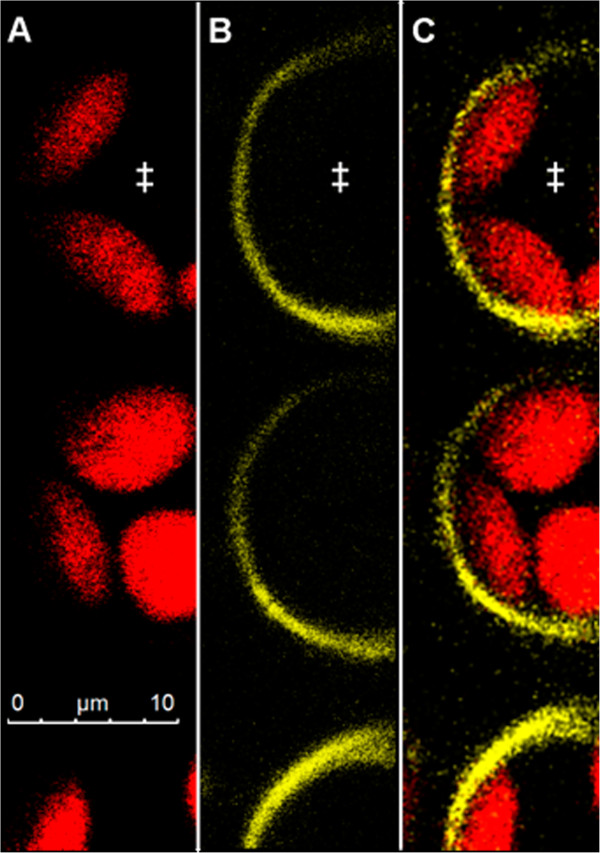
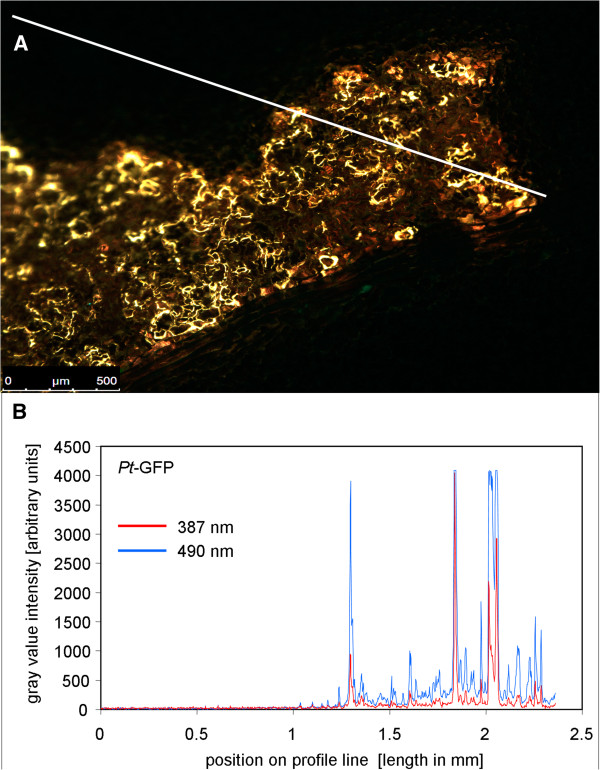
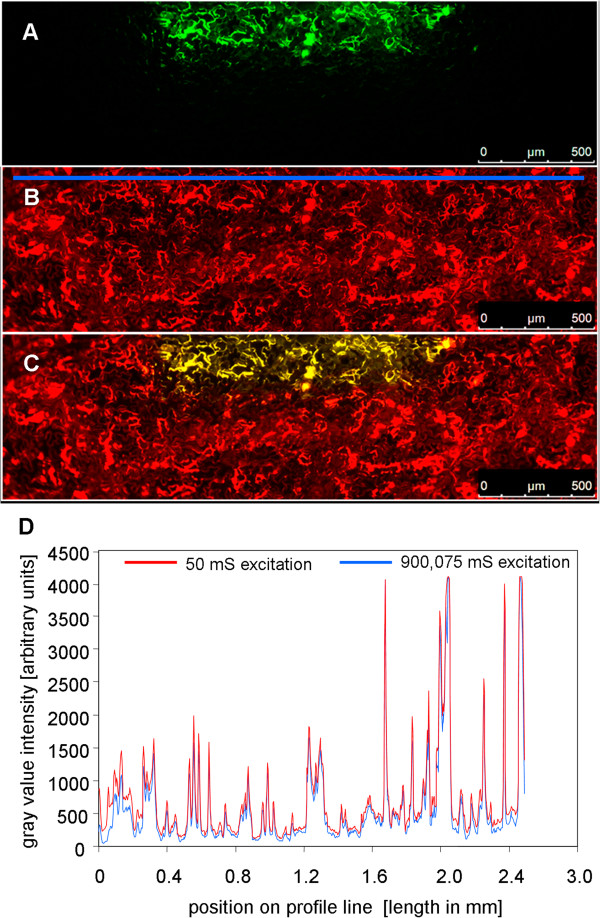
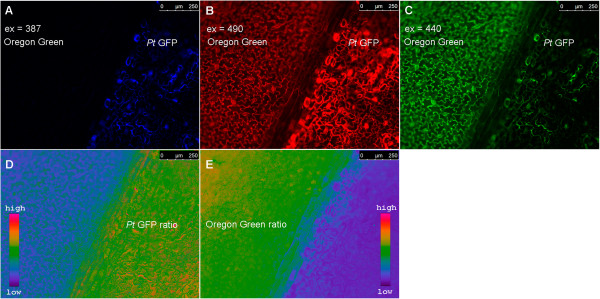
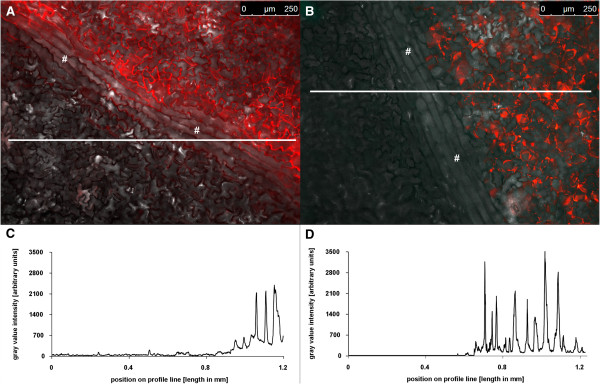
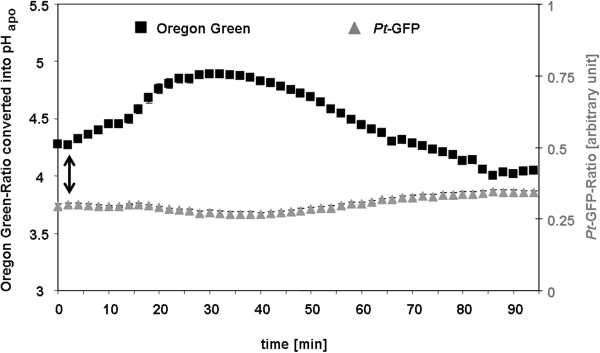
Results: Pt-GFP was purified using a bacterial expression system and subsequently loaded through stomata into the leaf apoplast of intact plants. Imaging verified the apoplastic localization of Pt-GFP and excluded its presence in the symplast. The pH-dependent emission signal stood out clearly from the background. PtGFP is highly photostable, allowing ratiometric measurements over hours. By using this approach, a chloride-induced alkalinizations of the apoplast was demonstrated for the first in oat.

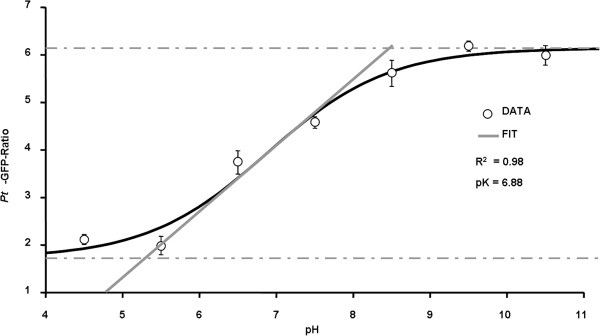
Conclusions: Pt-GFP appears to be an excellent sensor for the quantification of leaf apoplastic pH in the neutral range. The presented approach encourages to also use other genetically encoded biosensors for spatiotemporal mapping of apoplastic ion dynamics.

Keywords: Apoplast; GFP; Genetically encoded biosensor; Nitrogen forms; Plant bioimaging; Ptilosarcus gurneyi; Salinity; Signaling; Stress; Three-channel ratio imaging; pH.


Figures

Figure 1
Figure 1
Apoplastic distribution of the Pt -GFP in a Vicia faba leaf infiltrated 2–4 minutes prior image acquisition. Pt GFP is exclusively located in the apoplast. Confocal image in (A) shows adaxial view on palisade cell chloroplasts (exited at 633 nm; pseudo-red). Image in (B) shows same detail with Pt-GFP (excited at 488 nm; pseudo-yellow). (C) Overlay of (A) and (B) demonstrates that the Pt GFP is only located in the apoplast. No Pt GFP signal is emitted from between the chloroplasts, indicating that the Pt-GFP did not enter the cytosol. Moreover, the inside of the palisade cells remained black, proving that Pt-GFP did not enter the vacuole or other symplastic organelles, as otherwise signals would be detectable from the cells. Symplastic Pt GFP location was negated in several leaves derived from different plants. ‡, palisade cells.
Figure 2
Figure 2
Apoplastic distribution of the Pt -GFP in a Vicia faba leaf infiltrated 2.5 h prior image acquisition. Pt GFP is exclusively located in the apoplast. Confocal image in (A) shows adaxial view on palisade cell chloroplasts (exited at 633 nm; pseudo-red). Image in (B) shows same detail with Pt-GFP (excited at 488 nm; pseudo-yellow). (C) Overlay of (A) and (B) verifies the apoplastic distribution of the Pt-GFP that is attached outside of the palisade cells and, by this means, outlines the cell boundaries at 2.5 hours after loading. No Pt-GFP signal is emitted from between the chloroplasts, proofing that no Pt-GFP had entered the cytosol. Symplastic Pt GFP location was negated in several leaves derived from different plants. ‡, palisade cells.
Figure 3
Figure 3
Pt -GFP emission signals are markedly higher than unspecific background signals. (A) Overlay of ex 490 nm (pseudo-green) and ex 387 nm (pseudo-blue) fluorescence images shows adaxial leaf apoplast that was partially loaded with the Pt-GFP. Under illumination, dye-loaded areas appear yellowish because pseudo-green and pseudo-blue are mixed within the overlay. Areas that were not loaded with the pH reporter protein appear black when illuminated and serve to compare the amount of unspecific signals (background) to signals that are specifically emitted from the proteins. For this comparison, the intensity of grey values was chosen as a measure for signal intensity. A profile of the intensity values was taken from the white line in (A) and is presented in (B). Profiles are displayed for both fluorescence excitation channels (F 490 and F 387). Only negligible signals were emitted from the area without dye and signals were much higher in the dye-loaded areas. Twelve separate images captured from different plants proved the low background intensity.
Figure 4
Figure 4
Pt -GFP is photostable. (A) The leaf apoplast of Vicia faba was loaded with Pt-GFP. To test whether Pt-GFP is prone to bleaching, a selected area (pseudo-green) was designated to be continuously excited by 490 nm illumination over a period of 15 min (=900,000 ms). The outer edges of the specimen were protected against continuous illumination by foreclosing the field diaphragm (non-bleached are appears black). Prior bleaching was started, initial signal intensity of the specimen was documented (image not shown). (B) After 900,000 ms continuous excitation, the field diaphragm was opened for collecting an image at ex 490 nm (exposure time was 25 mS). The image is presented in pseudo-red and contains the part of the specimen that was continuously illuminated (in total 3*25 ms illumination from three image acquisitions plus 900,000 ms from bleaching treatment) plus the area of the specimen that was not bleached (exposed in total to 2*25 ms illumination from two acquisitions). (C) Merged overlay of (A) and (B). The yellow area (mixing pseudo-red and pseudo-green yields orange) represents the part that was continuously exposed to light treatment (in total 900,075 ms) and, thus, contains the possibly bleached proteins. Pseudo-red area represents the non-bleached part of the leaf with only 50 ms illumination in total (due to image acquisition cycles). Image (B) was used to create a profile of the emission intensity values from the area tagged by the blue line as a measure for the photostability. This line covers the bleached and non-bleached areas. The intensity values are presented in (D). A comparison of the intensity values derived from the bleached and non-bleached areas revealed that no significant bleaching occurred after 15 min of continuous illumination. Eight separate bleaching experiments proved photostability of Pt-GFP.
Figure 5
Figure 5
Principle of ratiometric analysis using two pH indicators within a single image frame. Fluorescence images shows adaxial view of Vicia faba leaf as excited at (A) F 387, (B) F 490 and (C) F 440. Leaf apoplast as loaded with the pH-indicator protein Pt-GFP (right of leaf vein) and the pH-indicator dye Oregon Green-dextran 488 (left of leaf vein). Images were captured approximately 3 hours after loading. The fluorescence ratios (D) F 490/F 387 (Pt-GFP) and (E) F 490/F 440 (Oregon Green 488-dextran) were obtained as a measurement of pH. Emission was collected at 510/84 for both Pt-GFP channels and 535/25 for both OG channels. For this reason, the F 490 channel was captured two times, once with emission 510/84, then with emission 535/25 (only the 535/25 emission image is shown in this figure). The ratios were coded by hue on a spectral colour scale ranging from purple (no signal) to blue (lowest signal) to pink (highest signal). Following this new loading strategy, leaf regions loaded with different indicators could be monitored and ratios were calculated according to the optimal wavelength of the respective indicator.
Figure 6
Figure 6
Leaf vein as a structural barrier that separates apoplastically located dyes. Adaxial leaf apoplast partially loaded with (A) Oregon Green 488-dextran or with (B) Pt-GFP. Overlay of pseudo-red fluorescence image at F490 and corresponding bright field image captured approximately 3 hours after loading. Dye-loaded areas in (A) and (B) appear red. Areas that were not loaded with the fluorescent pH reporter appear grey when illuminated and serve as a suitable area to compare the amount of unspecific signals (background) to specific signals being emitted from the pH reporters. For this, the intensity of grey values was chosen as a measure for emitted signal intensity. A profile of the intensity values was taken from the white line in (A) and is presented in (C). The same was done for the Pt-GFP: The intensity values were taken from the white line in (B) and are presented in (D). Only negligible signals were emitted from the areas without pH indicator that were separated by the leaf vein from the loaded apoplast. Signals were markedly higher in the dye-loaded areas. #, leaf vein. Results were confirmed by 10 replicates captured from different plants.
Figure 7
Figure 7
Unsuitability of Pt -GFP in the acid leaf apoplast of Vicia faba . Comparison between the responsiveness of the pH indicator protein Pt-GFP (grey) and the pH indicator dye Oregon Green (black) to apoplastic pH changes as induced by the addition of 50 mM Cl via L-cysteinium chloride to the roots of Vicia faba. Time point of chloride addition is indicated by the arrow. pH, as quantified at the adaxial face of Vicia faba leaves is plotted over time. Fluorescence ratio data obtained by Pt-GFP were below the linear range of the in vivo pH calibration and, therefore, could not be converted into pH data. Leaf apoplastic pH quantification was averaged (n = 6 ROIs per ratio image and time point; mean ± SE of ROIs). Representative kinetics of eight equivalent recordings of plants gained from 8 independent experiments.
Figure 8
Figure 8
In vivo calibration of Pt -GFP fluorescence ratio (F 490 /F 387 ). The Boltzmann fit was chosen for fitting sigmoidal curves to calibration ratio data. Fitting resulted in an optimal dynamic range for pH measurements between 5.3 and 8.4. In vivo calibration was conducted on six different plants, each biological replicate was technically replicated. Data are mean of n = 6 ± SE.
Figure 9
Figure 9
Nitrate nutrition alkalized the leaf apoplast into Pt -GFP’s range of responsiveness. Comparison between the responsiveness of Pt-GFP (grey) and Oregon Green (black) to apoplastic pH changes as induced by the addition of 25 mM Cl via L-cysteinium chloride to the roots of Vicia faba. Time point of chloride addition is indicated by the arrow. Plants were cultivated with 15 mM nitrate in the nutrient solution given as Ca(NO3)2. pH as quantified at the adaxial face of Vicia faba leaves is plotted over time. Leaf apoplastic pH was averaged (n = 6 ROIs per ratio image and time point; mean ± SE of ROIs). Representative kinetics of six equivalent recordings of plants gained from independent experiments (n = 6 biological replicates).
Figure 10
Figure 10
Near neutral leaf apoplast in Avena sativa requires Pt -GFP for detecting alkalizing effects. Leaf apoplastic pH response of Avena sativa as provoked by the addition of 25 mM Cl via L-cysteinium chloride into the nutrient solution. Time point of chloride addition as indicated by the arrow. pH, as quantified at the adaxial leaf face is plotted over time. Pt-GFP, grey curve; Oregon Green, black curve. Plants were cultivated with 15 mM nitrate in the nutrient solution given as Ca(NO3)2. Leaf apoplastic pH was averaged (n = 6 ROIs per ratio image and time point; mean ± SE of ROIs). Representative kinetics of eight equivalent recordings of plants gained from independent experiments (n = biological replicates).

Similar articles

Cited by

References

    1. Schulte A, Lorenzen I, Bötcher M, Plieth C. A novel fluorescent pH probe for expression in plants. Plant Methods. 2006;2:7. doi: 10.1186/1746-4811-2-7. - DOI - PMC - PubMed
    1. Monshausen GB, Miller ND, Murphy AS, Gilroy S. Dynamics of auxin-dependent Ca2+ and pH signalling in root growth revealed by integrating high-resolution imaging with automated computer vision-based analysis. Plant J. 2011;65:309–318. doi: 10.1111/j.1365-313X.2010.04423.x. - DOI - PubMed
    1. Sanders D. Generalized kinetic analysis of ion driven cotransport systems: II. random ligand binding as a simple explanation for non-Michaelis kinetics. J Membr Biol. 1986;90:67–87. doi: 10.1007/BF01869687. - DOI - PubMed
    1. Lemoine R, Delrot S. Proton-motive-force-driven sucrose uptake in sugar beet plasma membrane vesicles. FEBS Lett. 1989;249:129. doi: 10.1016/0014-5793(89)80030-4. - DOI
    1. Bush DR. Proton-coupled sugar and amino acid transporters in plants. Annu Rev Plant Physiol Plant Mol Biol. 1993;44:513–542. doi: 10.1146/annurev.pp.44.060193.002501. - DOI

LinkOut - more resources