. 2014 Oct 13;207(1):139-58.
doi: 10.1083/jcb.201402079.

Asynchronous remodeling is a driver of failed regeneration in Duchenne muscular dystrophy

Affiliations

Asynchronous remodeling is a driver of failed regeneration in Duchenne muscular dystrophy

Sherry Dadgar et al. J Cell Biol. .

Abstract

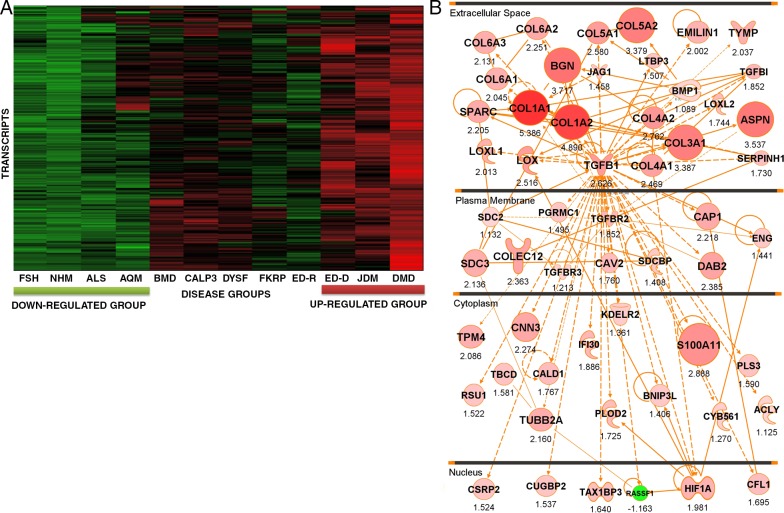
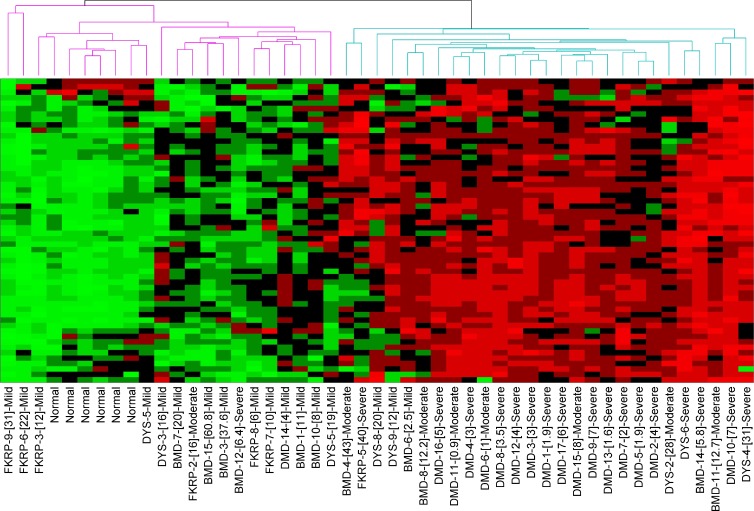
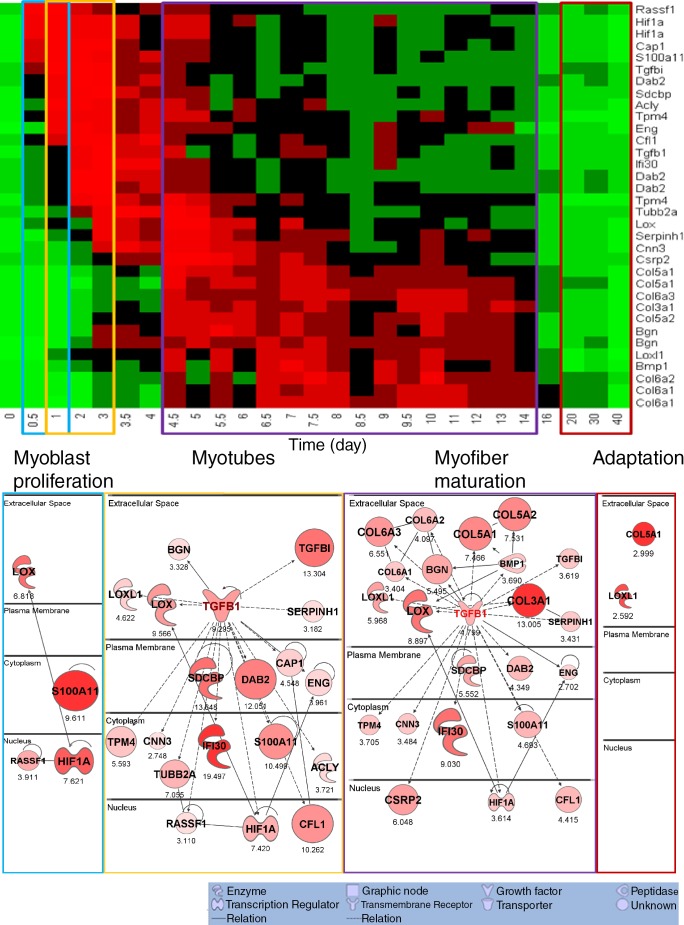
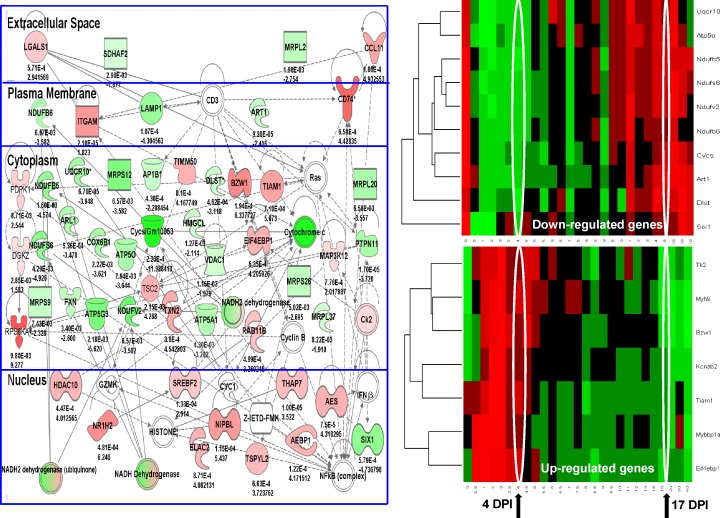
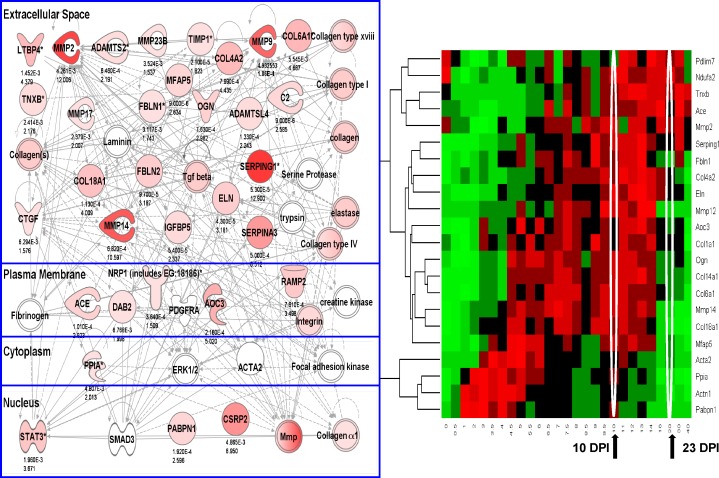
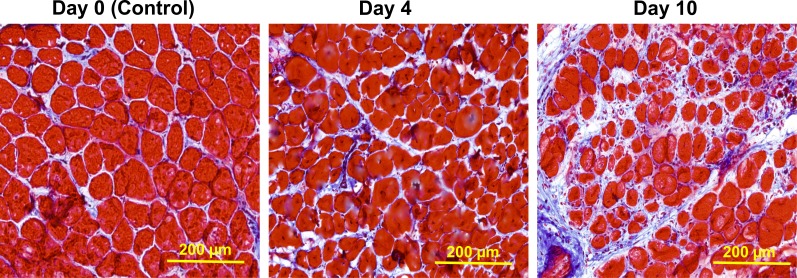
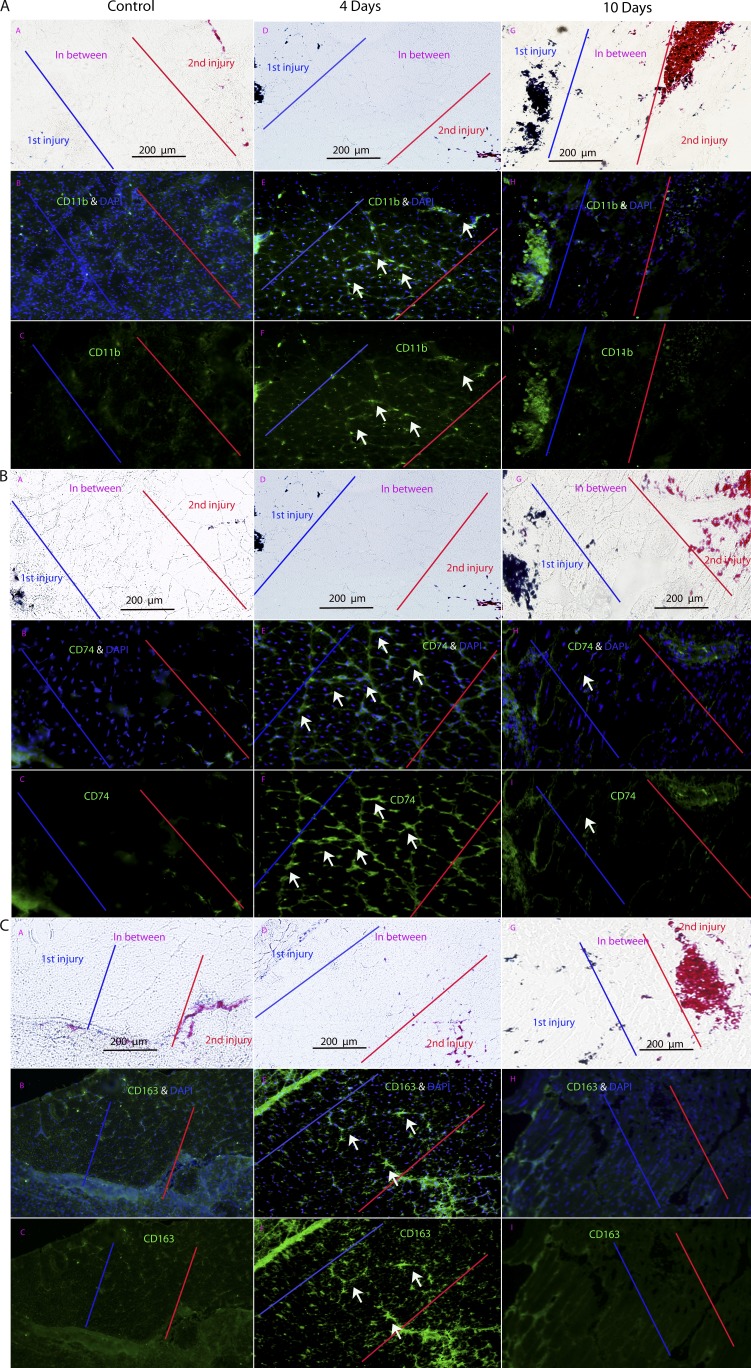
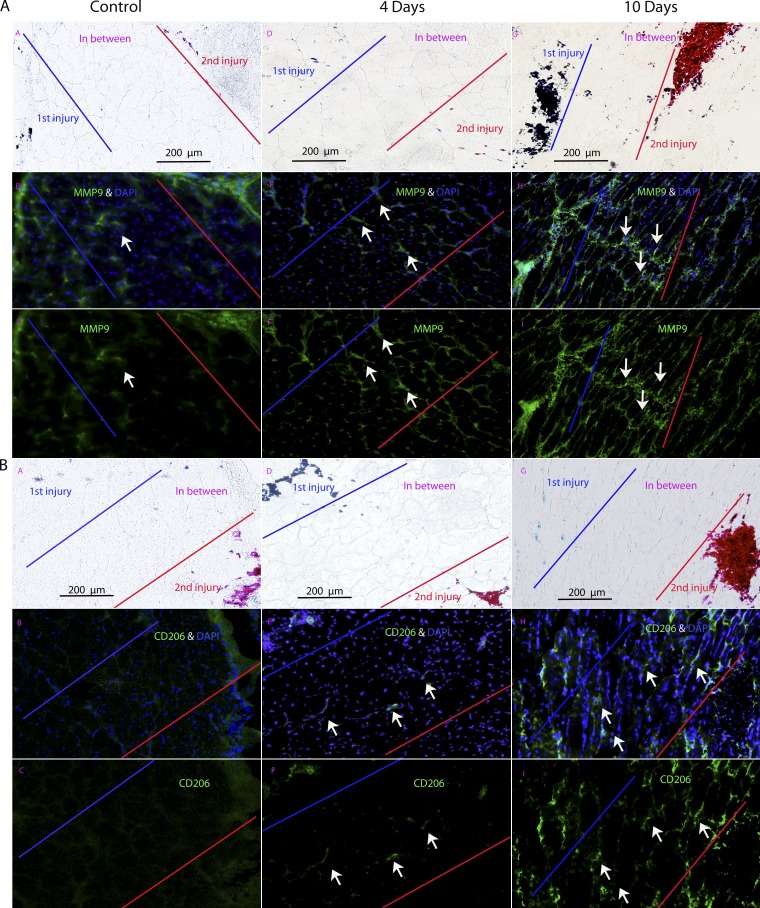
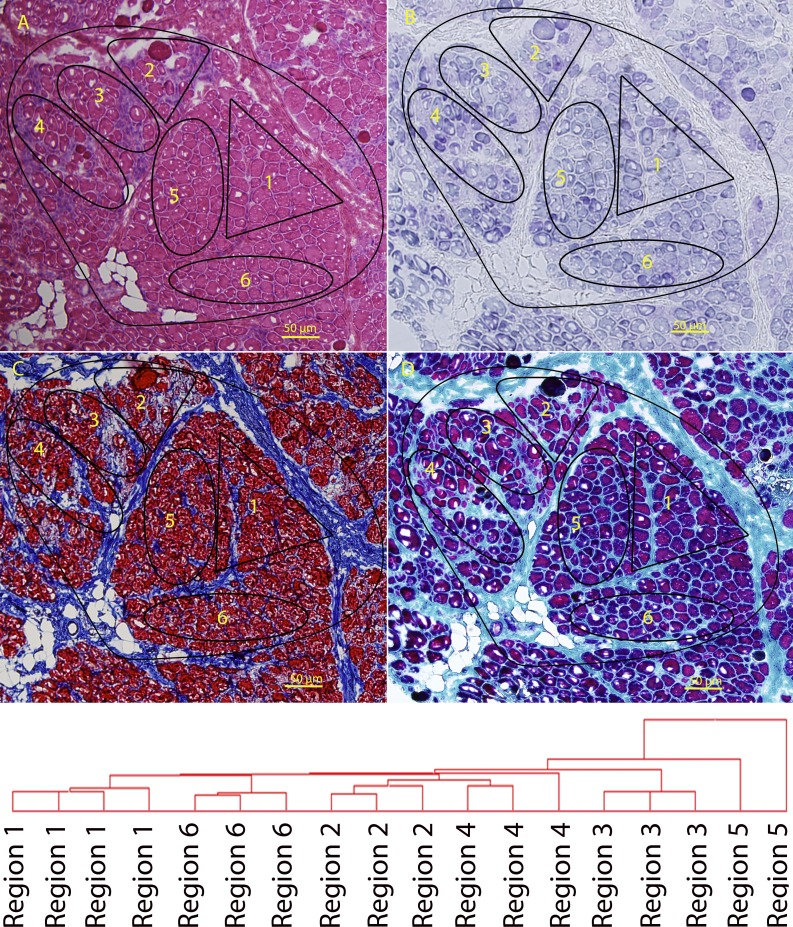
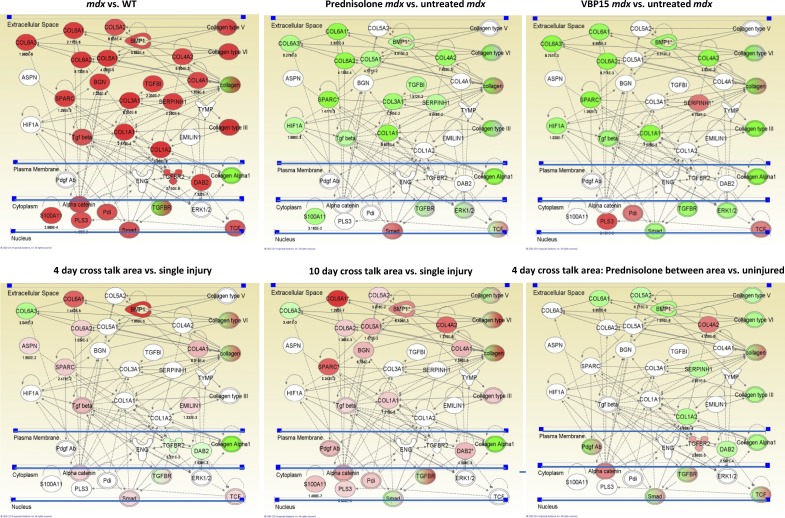
We sought to determine the mechanisms underlying failure of muscle regeneration that is observed in dystrophic muscle through hypothesis generation using muscle profiling data (human dystrophy and murine regeneration). We found that transforming growth factor β-centered networks strongly associated with pathological fibrosis and failed regeneration were also induced during normal regeneration but at distinct time points. We hypothesized that asynchronously regenerating microenvironments are an underlying driver of fibrosis and failed regeneration. We validated this hypothesis using an experimental model of focal asynchronous bouts of muscle regeneration in wild-type (WT) mice. A chronic inflammatory state and reduced mitochondrial oxidative capacity are observed in bouts separated by 4 d, whereas a chronic profibrotic state was seen in bouts separated by 10 d. Treatment of asynchronously remodeling WT muscle with either prednisone or VBP15 mitigated the molecular phenotype. Our asynchronous regeneration model for pathological fibrosis and muscle wasting in the muscular dystrophies is likely generalizable to tissue failure in chronic inflammatory states in other regenerative tissues.


Figures

Figure 1.
Figure 1.
An iterative composite scoring bioinformatics approach identifies a transcript network associated with progressive muscular dystrophy. (A) Shown is a heat map of 117 muscle biopsies grouped by diagnostic category. The individual transcripts (y axis) defining this disease clustering were used to generate the molecular network in B. Disorders studied were facioscapulohumeral muscular dystrophy (FSH), normal human skeletal muscle (NHM), amyotrophic lateral sclerosis (ALS), acute quadriplegic myopathy (AQM), Becker muscular dystrophy (BMD), LGMD2A (CALP3), LGMD2B (DYSF), LGMD2I (FKRP), Emery–Dreifuss muscular dystrophy X-linked (EMRN [emerin]), Emery–Dreifuss muscular dystrophy autosomal dominant (ED-D; LMNA mutations), juvenile dermatomyositis (JDM), and Duchenne muscular dystrophy (DMD). (B) Shown is the integration of component mRNAs from the clustering in A into functional relationships based upon the literature (IPA). The top-ranked Ingenuity networks were merged into a 56-transcript network. This network is seen to be centered on TGF-β and fibrosis (collagens and other extracellular matrix transcripts), and the network is visualized based on the typical subcellular localization of the encoded proteins of each transcript. Red symbols represent up-regulated transcripts, with the size of the symbol and intensity of color scaled to the observed fold change between groups (DMD, JDM, and ED-D vs. FSH, ALS, and NHM), with fold change with the PLIER algorithm provided under each symbol. Statistical data corresponding to this network are provided in Table 1.
Figure 2.
Figure 2.
Unsupervised (blinded) clustering of individual muscle biopsies from a 49-biopsy validation mRNA profiling dataset. Shown is a heat map using the same 56-member TGF-β network from Fig. 1 B, with visualization of unsupervised clustering of individual biopsies. The specific mRNAs are on the y axis (not depicted), with individual patient biopsies on the x axis (diagnosis, patient number, [age at biopsy], and blinded classification of severity of the histology [normal, mild, moderate, and severe]). The heat map shows bimodal stratification of biopsies (two branches of dendrogram at the top), with the right branch clustering those biopsies with high levels of all or most of these transcripts, whereas the left branch shows lower levels of these transcripts. This clustering is seen to be driven by the severity of the pathology and not patient diagnosis or age (right branch, moderate or severe dystrophic pathology; left branch, normal or mild dystrophic pathology).
Figure 3.
Figure 3.
The TGF-β network superimposed on normal mouse muscle regeneration shows strong induction of subsets of the network at specific time frames during regeneration. The components of the human TGF-β network (Fig. 1 B) were cross-mapped to the mouse genome and queried in a 27–time point muscle regeneration mRNA profiling dataset (Zhao et al., 2003). The top shows heat map visualization, with network members listed on the right y axis, and the time points after regeneration are shown on the x axis (days). Each member of the TGF-β network shows up-regulation within certain stages of normal staged muscle regeneration, although these stages vary depending on the specific network member. The time points are shown grouped (colored boxes) into early myoblast proliferation stage (blue box), myotube stage (yellow box), myofiber maturation stage (purple box), and late myofiber adaptation stage (red box). The transcripts showing up-regulation within each of these stages of regeneration were then used to generate networks (bottom). This shows that the TGF-β network seen in muscular dystrophy muscle (Fig. 1 B) is parsed into subnetworks based upon the stage of normal regeneration that the subset of transcripts is expressed. Numbers indicate fold change. Statistical data associated with this network and heat map visualization are provided in Table 2.
Figure 4.
Figure 4.
Muscle tissue areas located between asynchronous injuries spaced 4 d apart show chronic inflammation and loss of mitochondrial transcripts. LCM was used to isolate regions of myofibers in between injury sites (cross talk area) spaced 4 d apart, with muscles studied 13 d after the second injection when myofiber regeneration was expected to be largely complete. Shown is the top-ranked Ingenuity network (left) reflective of chronic inflammation (red gene/protein symbols), and loss of mitochondrial components (green symbols). This network was then superimposed on normal murine regeneration time series (right), separated by the mitochondrial-related transcripts (down-regulated genes; top right) and inflammatory transcripts (up-regulated genes; bottom right). The mice that were sacrificed after regeneration should be largely complete (17 d postinjection [DPI]). However, the myofibers between the two injury sites showed expression patterns that were more consistent with the 4-d time point (4 d postinjection). Statistical analyses associated with the heat map are provided in Table 4. These data suggest that the myofibers in between the two injury sites are suspended in a time period of regeneration, defined by the days between the two sequential injuries (cross talk microenvironment). Numbers indicate p-value (top) and fold change (bottom).
Figure 5.
Figure 5.
Muscle tissue areas located between asynchronous injuries spaced 10 d apart show a high level expression of profibrotic gene networks. Shown is data for the LCM region of muscle between the two injury sites spaced 10 d apart. The myofibers between the two injury sites show a high level expression of transcripts associated with connective tissue proliferation and fibrosis (top-ranked Ingenuity network, left). Superimposing this network on normal staged murine regeneration shows that the myofibers in the area between the two injury sites show expression patterns consistent with suspension in the 10-d time point of normal regeneration. Statistical analyses associated with the heat map are provided in Table 4. Numbers indicate p-value (top) and fold change (bottom). DPI, day postinjection.
Figure 6.
Figure 6.
Histological analysis of connective tissue proliferation (fibrosis). Shown is Masson’s modified trichrome staining of cryosections in the area of muscle between injection sites staged 0, 4, and 10 d apart (n = 3 muscles per group). Endomysial fibrosis is most evident in the area between injections space 10 d apart, consistent with the LCM expression profiling data (Fig. 4 B).
Figure 7.
Figure 7.
Immunostaining of inflammatory proteins CD11b, CD74, and CD163 shows expression specific to intervening areas of muscle between injuries spaced 4 d apart. (A–C) Shown are immunofluorescence stains for inflammatory protein markers CD11b (A), CD74 (B), and CD163 (C). Each panel shows matched phase contrast (marking injury sites with tattoo dyes), antigen with nuclear stains (DAPI), and antigen alone. All three inflammatory markers show preferential localization in the area between the two injury sites only when injuries are spaced 4 d apart and not 0 or 10 d apart (n = 3 muscles per group). Arrows indicate immunoreactive material in the microenvironment between two neighboring sites of regeneration.
Figure 8.
Figure 8.
Immunostaining of proteins profibrotic markers MMP9 and CD206 shows preferential expression the area of muscle between injuries spaced 10 d apart. (A and B) Two markers associated with fibrosis, MMP9 (A) and CD206 (B), are shown by immunostaining in muscles from repeated injuries (control = 0 d apart; 4 and 10 d apart). Both markers show preferential expression in the area in between the two injury sites when the injuries are spaced 10 d apart and not 0 (control) or 4 d (n = 3 muscle per group). Arrows indicate immunoreactive material in the microenvironment between two neighboring sites of regeneration.
Figure 9.
Figure 9.
LCM of regions of a muscle biopsy from a DMD patient. (A–D) A frozen muscle biopsy from a 3-yr-old DMD patient was stained for hematoxylin and eosin (A), mitochondrial enzyme activity (SDH; B), Masson’s modified trichrome (C), and Gomori’s modified trichrome (D). Variable states of degeneration and regeneration can be seen within each fascicle. The different regions indicated (1–6) were isolated by LCM, and individual regions (n ≥ 3 per region) were analyzed by mRNA profiling. The areas were chosen based on visual histopathology, where both fascicles and relatively distinct histological subareas within the fascicles were chosen. Microarray data from replicates of LCM regions microdissected from adjacent cryosections was subjected to unsupervised chip-based clustering. This showed replicates to cluster closely in the dendrogram. This represents heterogeneity within fascicles in DMD muscle, as hypothesized by the asynchronous regeneration model described in the accompanying text.
Figure 10.
Figure 10.
Treatment with prednisone or VBP15 suppresses the TGF-β network in both WT asynchronous remodeling and mdx mice. Top images are mRNA profile data of skeletal muscles from a 4-mo preclinical drug trial of 5 mg/kg/d prednisone and 15 mg/kg/d VBP15. Muscle functional testing and histology on this trial has been previously published (Heier et al., 2013). The TGF-β and fibrosis pathways seen in experimental asynchronous remodeling and DMD biopsies were queried for the relative expression of mRNAs between the indicated samples, with red color indicating up-regulation (p-values underneath network members) and green color indicating down-regulation. Untreated mdx muscle shows strong up-regulation of the network (mdx vs. WT). Treatment with either prednisone (prednisone-treated mdx vs. untreated mdx) or VBP15 (VBP15-treated mdx vs. untreated mdx) shows strong suppression of this network. Bottom images show comparison of expression profiles from LCM samples of asynchronously remodeling regions of WT muscle. The cross talk region between injection sites shows up-regulation of the TGF-β fibrosis network (higher in 10 d compared with 4 d) and prednisone treatment of 4-d asynchronous remodeling mice with prednisone suppresses the network (pretreated, 4-d cross talk area vs. uninjured).

References

    1. Aguennouz, M., Vita G.L., Messina S., Cama A., Lanzano N., Ciranni A., Rodolico C., Di Giorgio R.M., and Vita G.. 2011. Telomere shortening is associated to TRF1 and PARP1 overexpression in Duchenne muscular dystrophy. Neurobiol. Aging. 32:2190–2197 10.1016/j.neurobiolaging.2010.01.008 - DOI - PubMed
    1. Akhurst, R.J., and Hata A.. 2012. Targeting the TGFβ signalling pathway in disease. Nat. Rev. Drug Discov. 11:790–811 10.1038/nrd3810 - DOI - PMC - PubMed
    1. Alcala, S.E., Benton A.S., Watson A.M., Kureshi S., Reeves E.M., Damsker J., Wang Z., Nagaraju K., Anderson J., Williams A.M., et al. . 2014. Mitotic asynchrony induces transforming growth factor-β1 secretion from airway epithelium. Am. J. Respir. Cell Mol. Biol. 51:363–369 10.1165/rcmb.2013-0396OC - DOI - PMC - PubMed
    1. Alexakis, C., Partridge T., and Bou-Gharios G.. 2007. Implication of the satellite cell in dystrophic muscle fibrosis: a self-perpetuating mechanism of collagen overproduction. Am. J. Physiol. Cell Physiol. 293:C661–C669 10.1152/ajpcell.00061.2007 - DOI - PubMed
    1. Bakay, M., Chen Y.W., Borup R., Zhao P., Nagaraju K., and Hoffman E.P.. 2002. Sources of variability and effect of experimental approach on expression profiling data interpretation. BMC Bioinformatics. 3:4 10.1186/1471-2105-3-4 - DOI - PMC - PubMed

Publication types

MeSH terms