. 2014 Oct 14;9(10):e109585.
doi: 10.1371/journal.pone.0109585. eCollection 2014.

Estimating the inbreeding depression on cognitive behavior: a population based study of child cohort

Affiliations

Estimating the inbreeding depression on cognitive behavior: a population based study of child cohort

Mohd Fareed et al. PLoS One. .

Erratum in

  • PLoS One. 2014;9(12):e115393

Abstract

Background: Cognitive ability tests are widely assumed to measure maximal intellectual performance and predictive associations between intelligence quotient (IQ) scores and later mental health problems. Very few epidemiologic studies have been done to demonstrate the relationship between familial inbreeding and modest cognitive impairments in children.

Objective: We aimed to estimate the effect of inbreeding on children's cognitive behavior in comparison with non-inbred children.

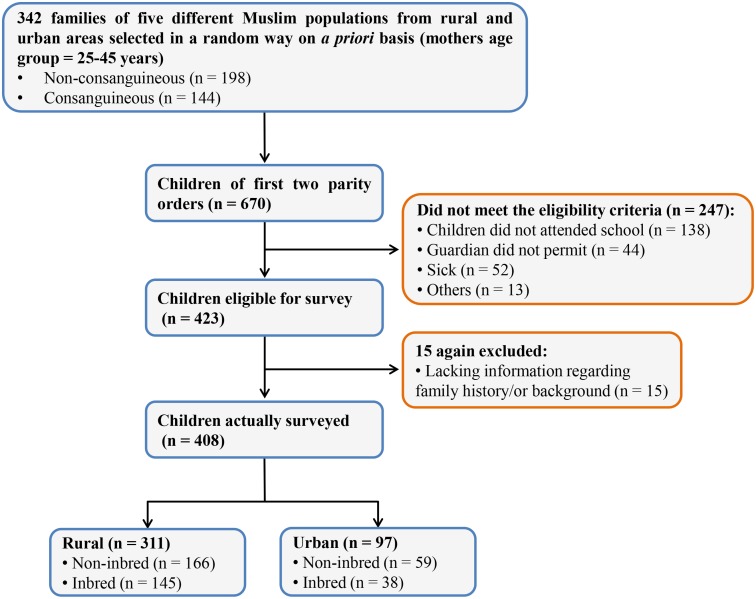
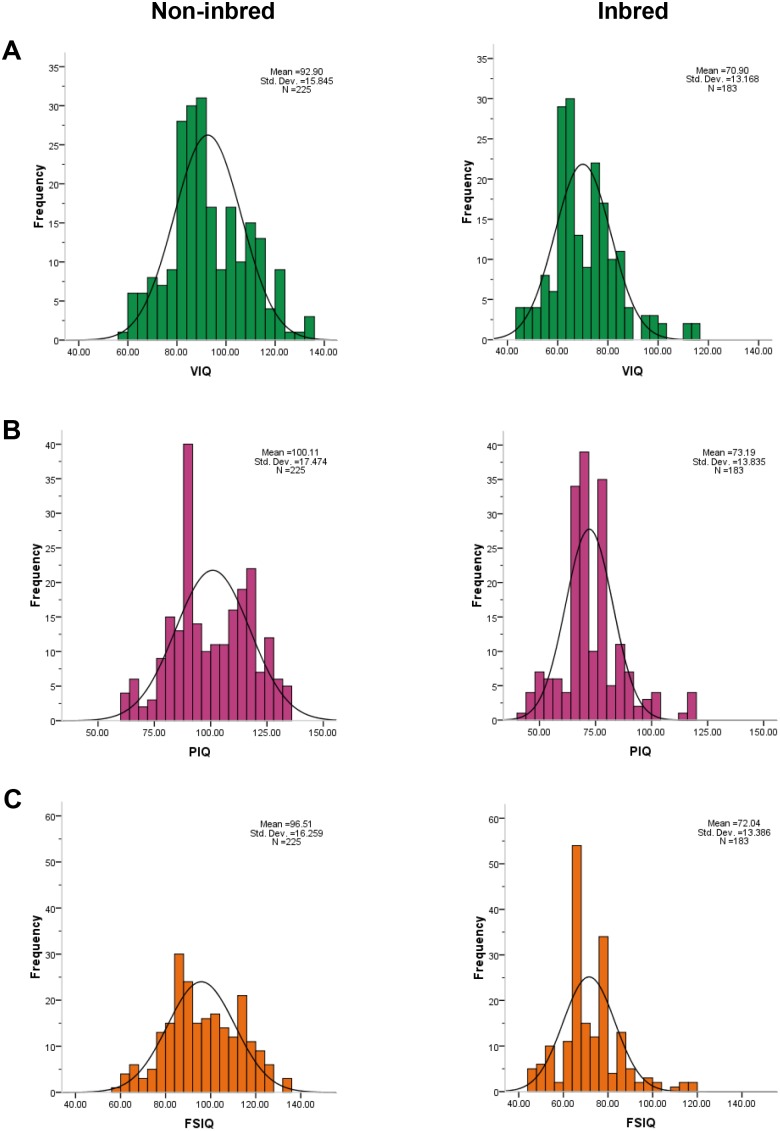
Methodology: A cohort of 408 children (6 to 15 years of age) was selected from inbred and non-inbred families of five Muslim populations of Jammu region. The Wechsler Intelligence Scales for Children (WISC) was used to measure the verbal IQ (VIQ), performance IQ (PIQ) and full scale IQ (FSIQ). Family pedigrees were drawn to access the family history and children's inbred status in terms of coefficient of inbreeding (F).

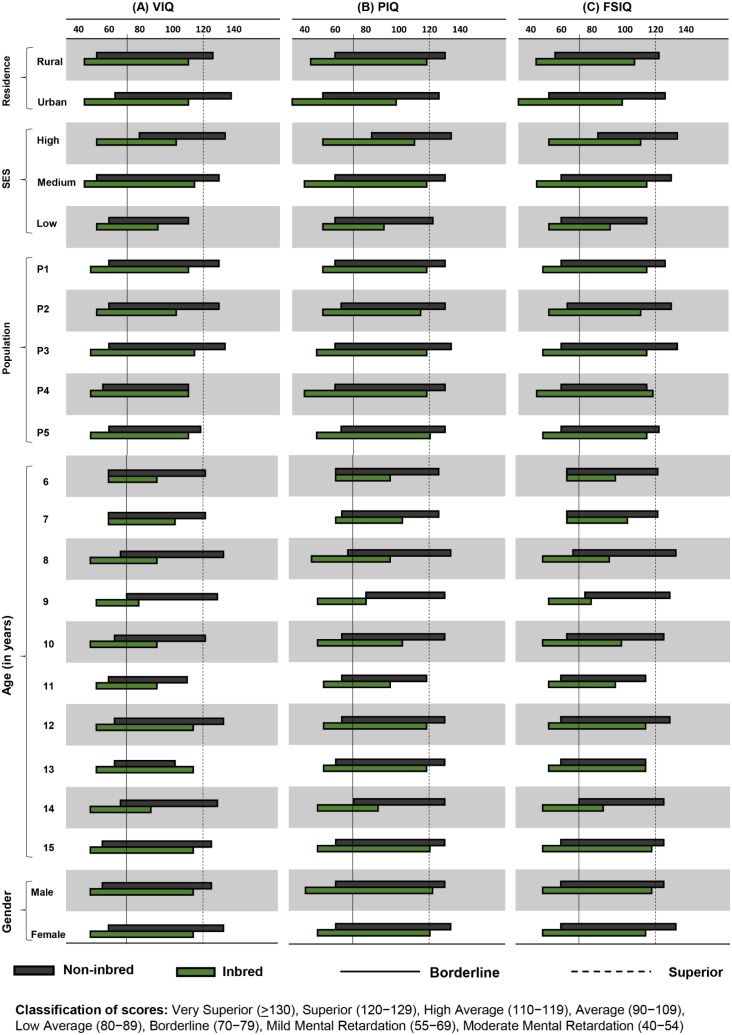
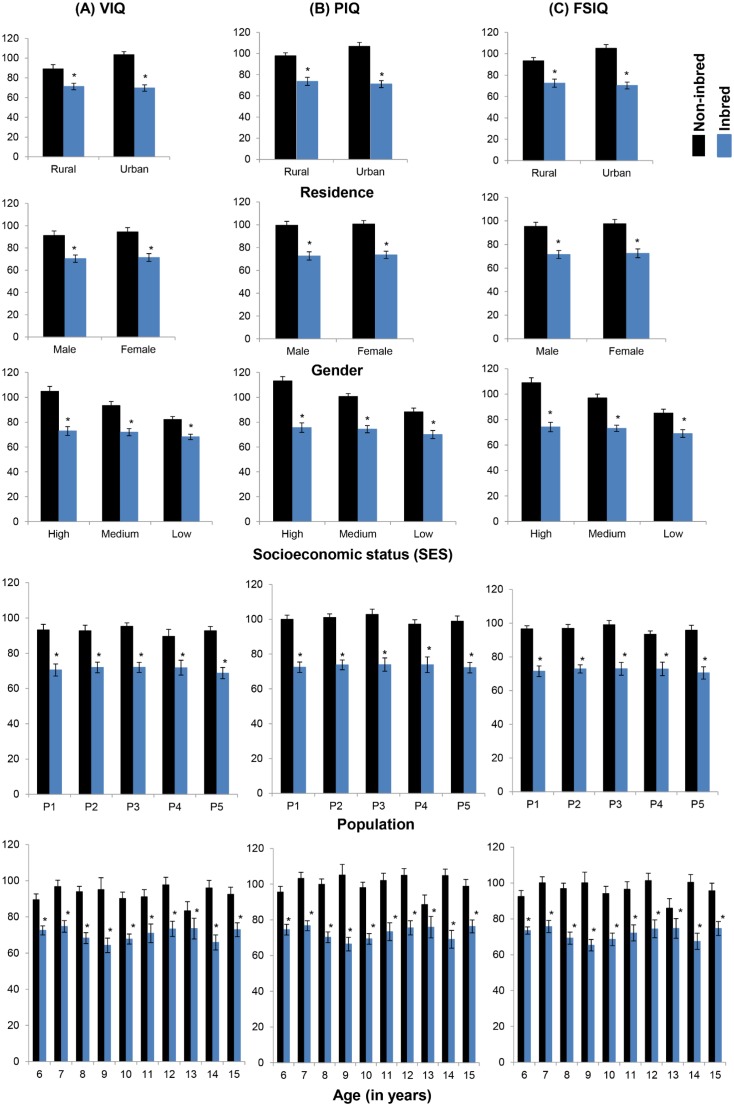
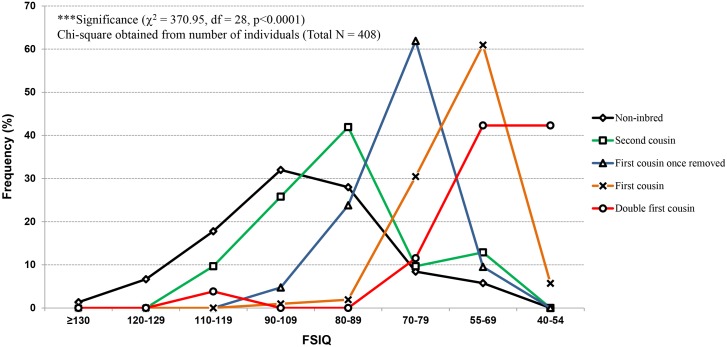
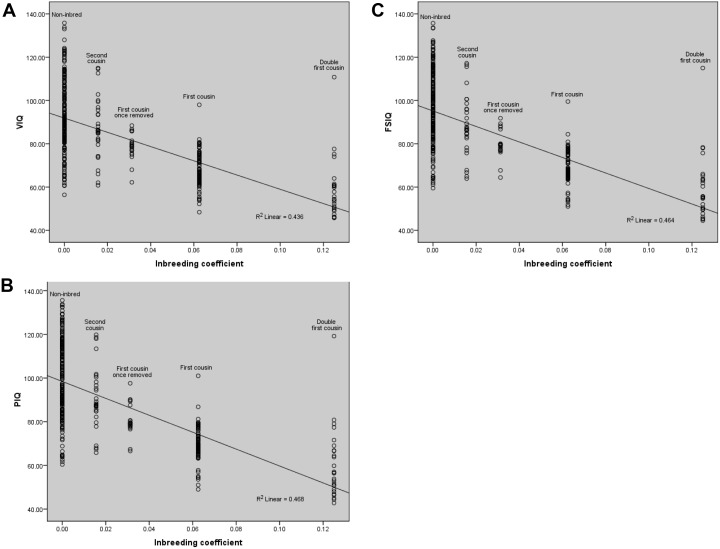
Results: We found significant decline in child cognitive abilities due to inbreeding and high frequency of mental retardation among offspring from inbred families. The mean differences (95% C.I.) were reported for the VIQ, being -22.00 (-24.82, -19.17), PIQ -26.92 (-29.96, -23.87) and FSIQ -24.47 (-27.35,-21.59) for inbred as compared to non-inbred children (p<0.001) [corrected].The higher risk of being mentally retarded was found to be more obvious among inbred categories corresponding to the degree of inbreeding and the same accounts least for non-inbred children (p<0.0001). We observed an increase in the difference in mean values for VIQ, PIQ and FSIQ with the increase of inbreeding coefficient and these were found to be statistically significant (p<0.05). The regression analysis showed a fitness decline (depression) for VIQ (R2 = 0.436), PIQ (R2 = 0.468) and FSIQ (R2 = 0.464) with increasing inbreeding coefficients (p<0.01).

Conclusions: Our comprehensive assessment provides the evidence for inbreeding depression on cognitive abilities among children.


Conflict of interest statement

Competing Interests: The authors have declared that no competing interests exist.

Figures

Figure 1
Figure 1. Study design.
Flowchart depicting the steps involved in the recruitment process.
Figure 2
Figure 2. Normal distribution of cognitive abilities among inbred in comparison with non-inbred children.
Differences in normal distributions of inbred in comparison with non-inbred children for VIQ, PIQ and FSIQ show highly significant results (at p<0.0001, using One-way Analysis of Variance). The mean difference (95% CI) for VIQ −22.00 (−24.82, −19.17), PIQ −26.92 (−29.96, −23.87) and FSIQ −24.47 (−27.35, −21.59) among inbred groups in comparison with non-inbred found to be statistically significant (at p<0.001, using Tukey-Kramer Comparisons Test). The non-inbred shows a regular pattern, whereas frequency distributions among inbred children represent a shift toward lower values and sparsity toward the high average or superior IQs.
Figure 3
Figure 3. Range distribution of cognitive abilities for different factors.
The IQ range has been established with minimum and maximum values observed for each category. Among all factors, inbred subjects exhibit a range shift toward low IQ, not crossing the superior IQ which is the indication of inbreeding load on the child’s cognitive abilities to have elevated levels of mental illness. Factors, like residence, SES and population (except age and sex) show significant differences though overall effect yet remained incompetent in comparison with inbreeding. The populations presented as, P1 = Gujjar and Bakarwal, P2 = Mughal, P3 = Malik, P4 = Syed, P5 = Khan.
Figure 4
Figure 4. Cognitive abilities among inbred and non-inbred children.
The results presented as mean±SEM. The significant decline in mean values observed for VIQ, PIQ and FSIQ among inbred children in comparison with non-inbred group. *The difference in mean values of inbred from non-inbred children for each factor is found to be statistically significant (p<0.05, using student’s t-test). Populations presented as, P1 = Gujjar and Bakarwal, P2 = Mughal, P3 = Malik, P4 = Syed, P5 = Khan.
Figure 5
Figure 5. FSIQ comparisons in respect to the degree of inbreeding.
The results depict the percentage frequency distribution of FSIQ in relation to coefficient of inbreeding. The non-inbred children display high frequency peaks on left side (presenting high FSIQ values) and downturn toward low FSIQ scores. On the other hand, elevated peaks are observed for low FSIQ scores (on right side) with the increase of inbreeding coefficient (F = 0.0156 to 0.125) and flattened toward high FSIQ scores, providing the evidence for inbreeding depression on children FSIQ.
Figure 6
Figure 6. Inbreeding depression on cognitive abilities.
The regression analysis presents almost similar trend for VIQ, PIQ and FSIQ. The slope depicts fitness decline (regression slope) with increase of inbreeding coefficient (F). The observed linear decline in fitness for cognitive parameters; (A) VIQ (R2 = 0.436), (B) PIQ (R2 = 0.468) and (C) FSIQ (R2 = 0.464) are found to be significant. Pearson correlation ‘r’ for VIQ, PIQ and FSIQ are −0.660, −0.684 and −0.681 respectively, and found to be statistically significant (p<0.01). The negative values indicate the decreasing trend for cognitive abilities due to inbreeding.
Figure 7
Figure 7. Pathways specifying factors involved in cognitive impairment.
The flowchart briefly explains the factors (i.e., environmental, social and genetic) causing cognitive impairment. These factors are inter-related directly or through indirect mechanisms. There are many sub-pathways of each factor, not mentioned here. Inbreeding (due to consanguineous marriages) is also overwhelmed by geography, environment and social norms. Inbreeding increases the homozygosity which in turn results into the expression of autosomal recessive genes that may be one of the causes for abnormal brain development and function.

References

    1. American Psychiatric Association (2013) The diagnostic and statistical manual of mental disorders DSM 5. Bookpoint US.
    1. Lynn R, Vanhanen T (2012) National IQs: A review of their educational, cognitive, economic, political, demographic, sociological, epidemiological, geographic and climatic correlates. Intelligence 40: 226–234.
    1. Reilly D (2012) Gender, culture, and sex-typed cognitive abilities. PLoS ONE 7: e39904. - PMC - PubMed
    1. Hanscombe KB, Trzaskowski M, Haworth CMA, Davis OSP, Dale PS, et al. (2012) Socioeconomic status (SES) and children’s intelligence (IQ): in a UK-representative sample SES moderates the environmental, not genetic, effect on IQ. PLoS ONE 7: e30320. - PMC - PubMed
    1. Maika A, Mittinty MN, Brinkman S, Harper S, Satriawan E, et al. (2013) Changes in socioeconomic inequality in Indonesian children’s cognitive function from 2000 to 2007: a decomposition analysis. PLoS ONE 8: e78809. - PMC - PubMed

Publication types

LinkOut - more resources