. 2014 Oct 14;9(10):e108913.
doi: 10.1371/journal.pone.0108913. eCollection 2014.

Integrated mRNA-microRNA profiling of human NK cell differentiation identifies MiR-583 as a negative regulator of IL2Rγ expression

Affiliations

Integrated mRNA-microRNA profiling of human NK cell differentiation identifies MiR-583 as a negative regulator of IL2Rγ expression

Sohyun Yun et al. PLoS One. .

Abstract

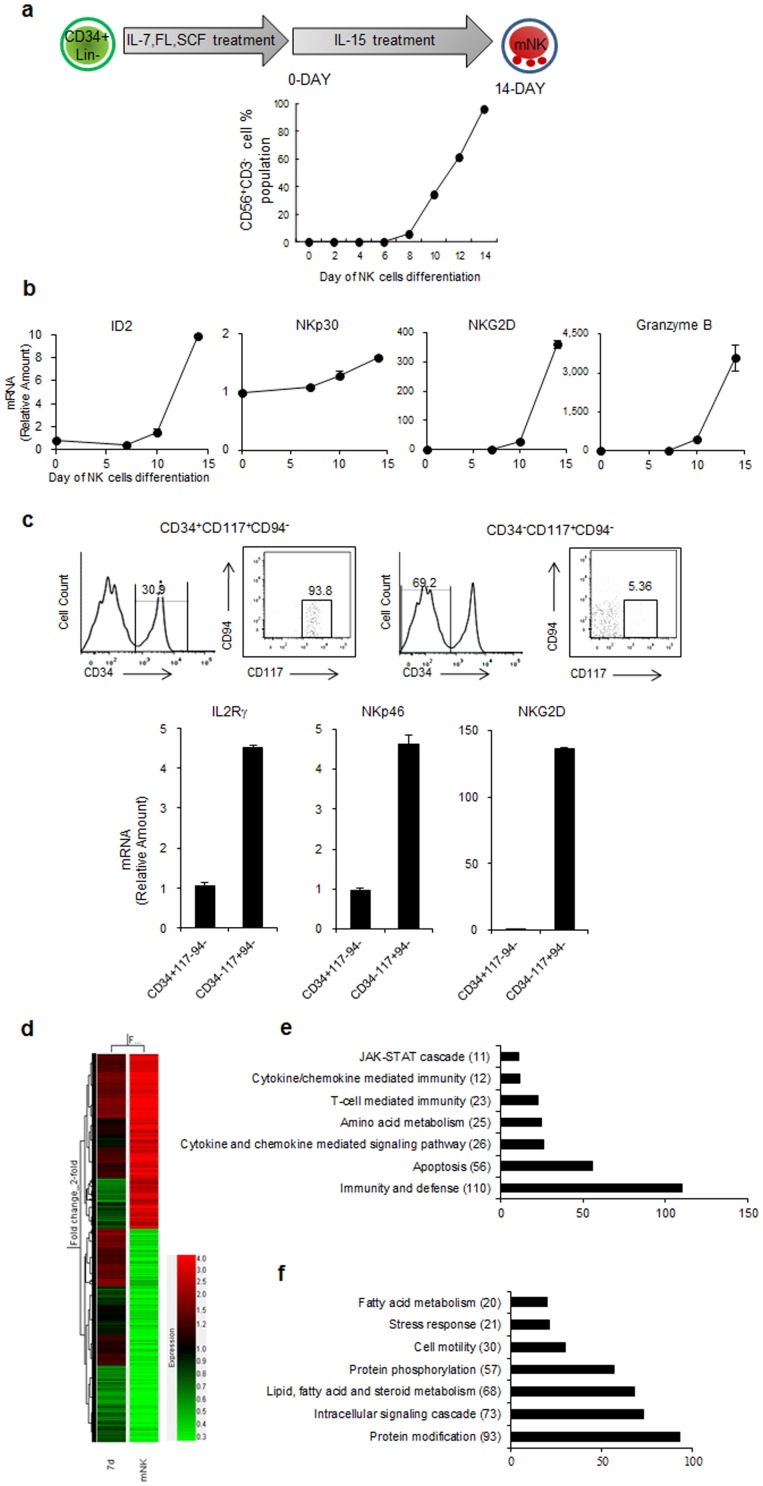
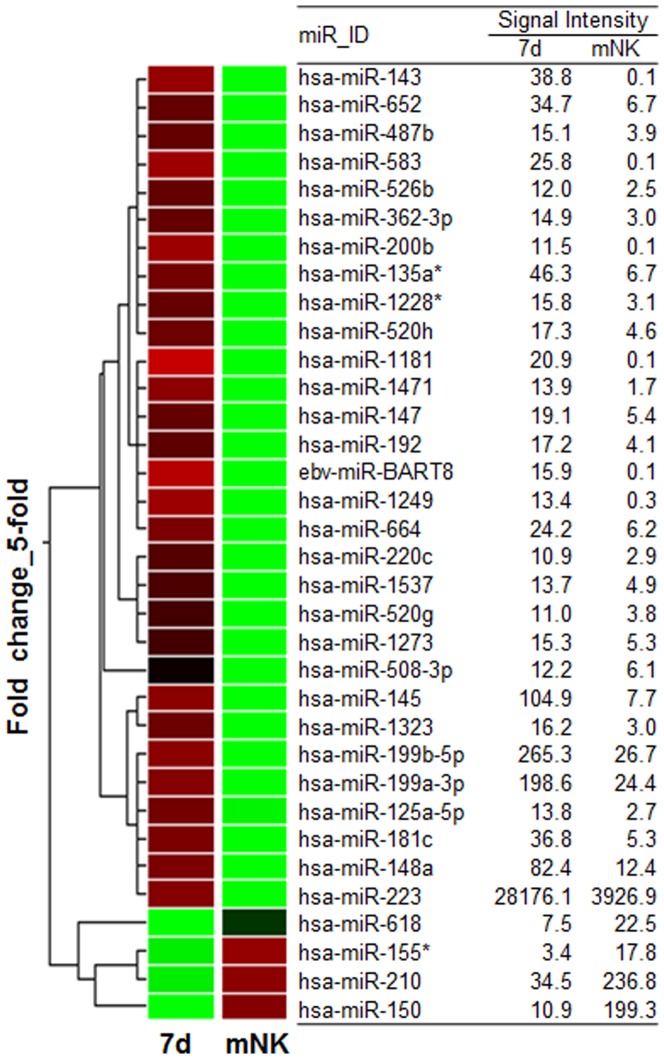
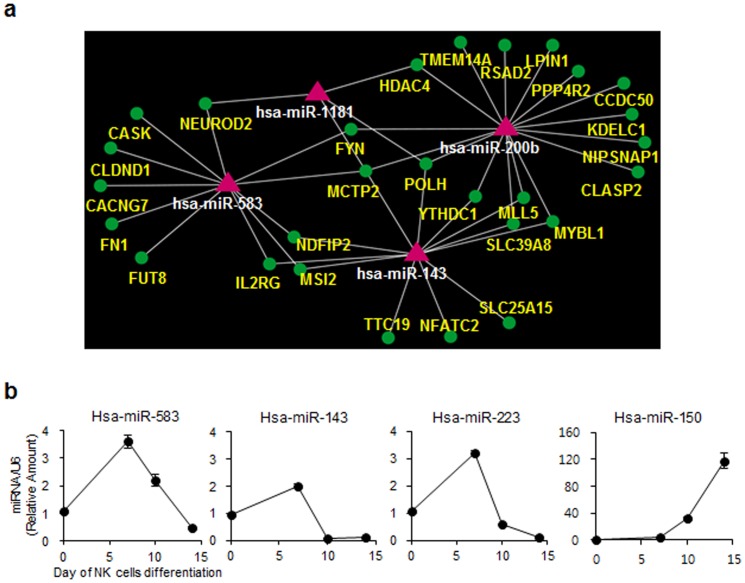
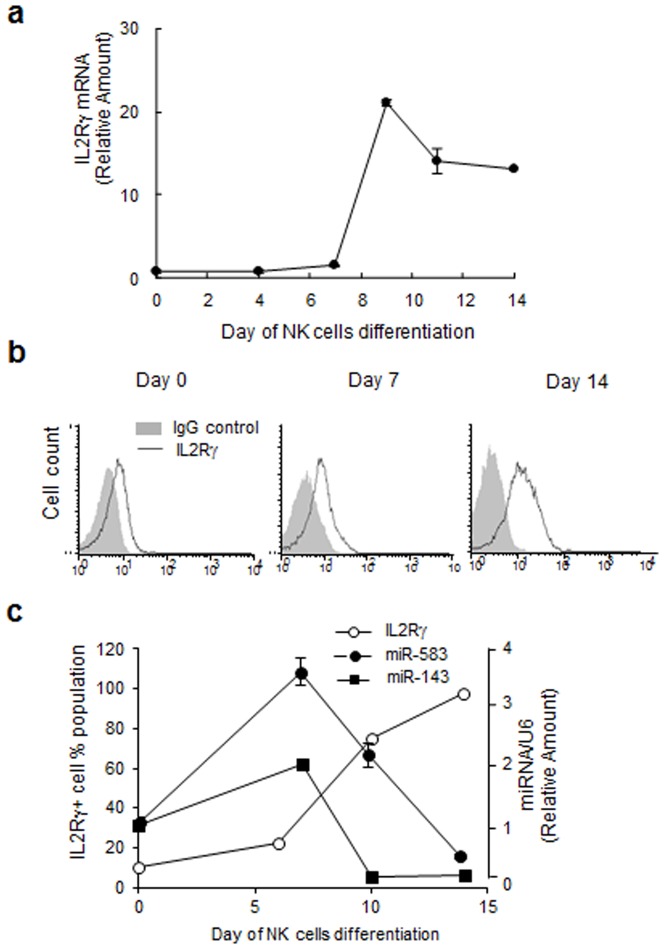
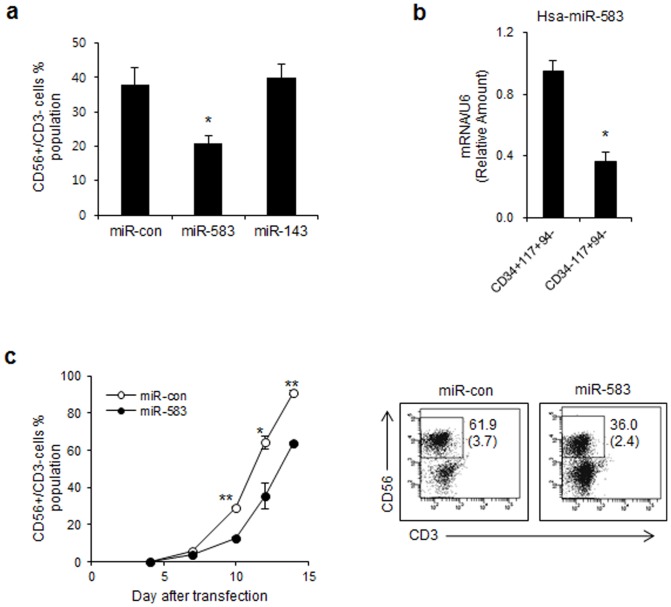
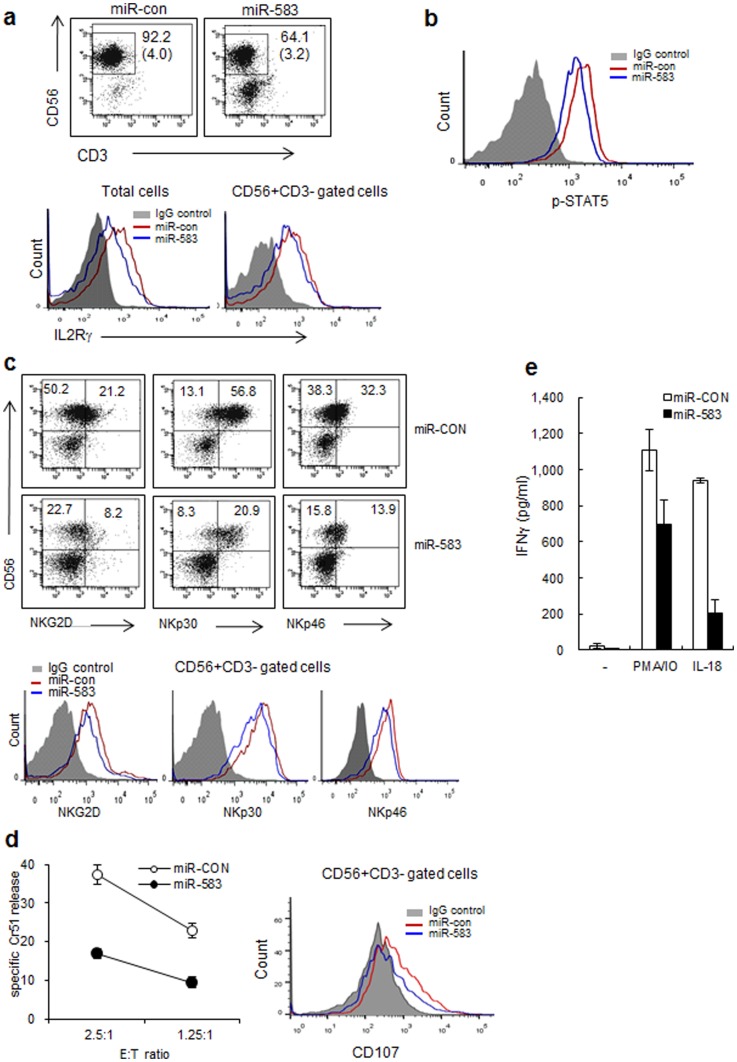
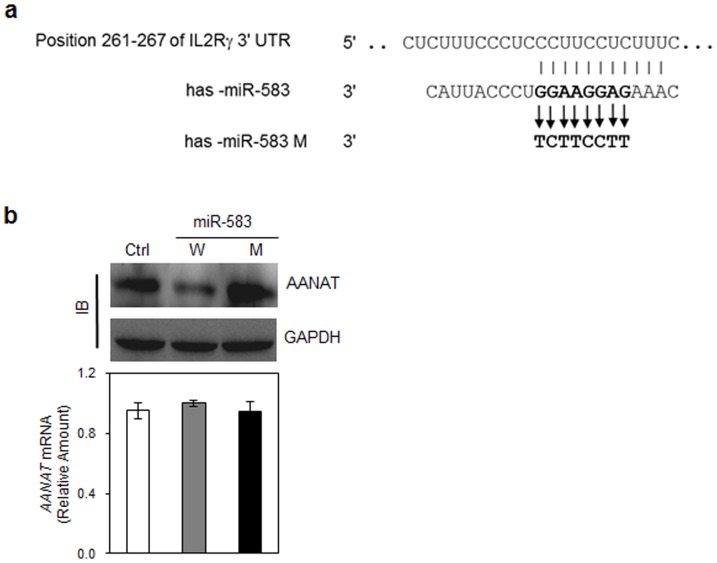
Natural killer (NK) cells are innate immune effector cells that protect against cancer and some viral infections. Until recently, most studies have investigated the molecular signatures of human or mouse NK cells to identify genes that are specifically expressed during NK cell development. However, the mechanism regulating NK cell development remains unclear. Here, we report a regulatory network of potential interactions during in vitro differentiation of human NK cells, identified using genome-wide mRNA and miRNA databases through hierarchical clustering analysis, gene ontology analysis and a miRNA target prediction program. The microRNA (miR)-583, which demonstrated the largest ratio change in mature NK cells, was highly correlated with IL2 receptor gamma (IL2Rγ) expression. The overexpression of miR-583 had an inhibitory effect on NK cell differentiation. In a reporter assay, the suppressive effect of miR-583 was ablated by mutating the putative miR-583 binding site of the IL2Rγ 3' UTR. Therefore, we show that miR-583 acts as a negative regulator of NK cell differentiation by silencing IL2Rγ. Additionally, we provide a comprehensive database of genome-wide mRNA and miRNA expression during human NK cell differentiation, offering a better understanding of basic human NK cell biology for the application of human NK cells in immunotherapy.


Conflict of interest statement

Competing Interests: The authors have declared that no competing interests exist.

Figures

Figure 1
Figure 1. Genome-wide mRNA expression.
(a) Isolated HPC (CD34+Lin) cells were cultured in IL-15-supplemented media, and the culture media was replaced every 48 h. The expression of CD56 as an NK cell surface marker was analyzed using FACS. (b) The kinetics of the mRNA expression of Id2, NKp30, NKG2D and Granzyme B were analyzed by real-time qPCR. (c) Stage 2 progenitors (CD34+CD117+CD94) and stage 3 progenitors (CD34CD117+CD94) were isolated from UCB by flow sorting. The mRNA expression of IL2Rγ, NKp46 and NKG2D were analyzed by real-time qPCR. (d) A dendrogram of hierarchical clustering revealed genes that were altered more than 2-fold in 7d- and 14-d (mNK) cultured NK cell compared with 1 d-cultured cells. (E-F) The bar graphs represent the top seven functional categories of upregulated (e) or downregulated (f) genes according to the gene ontology analysis (as determined by DAVID, as described in the Methods). The data are representative of three independent experiments performed using three different UCB samples and represent the mean values ± S.E.M. of duplicates.
Figure 2
Figure 2. Genome-wide miRNAs expression profiles.
A dendrogram showing hierarchical clustering for the miRNAs altered more than 5-fold in 7d-cultured cells compared with 14d-cultured (mNK) cells. The results are shown as the mean values of duplicate experiments.
Figure 3
Figure 3. A regulatory network of NK cell differentiation derived from an integrated analysis of miRNAs-mRNA microarray data.
(a) Negatively correlated miRNA-mRNA interactions were visualized as a network using Magia (miRNAs and genes integrated analysis web-based tool). This network provides for the first time a theoretical outline of the concerted action of regulating miRNAs (red triangles) and their potential target mRNAs (green circles). (b) Isolated HPC (CD34+Lin) cells were cultured as described in the Materials and Methods. After being cultured in IL-15-supplemented media, the cells were collected at the indicated time intervals. The expression of miR-143, miR-223, miR-150 and miR-583 was analyzed by real-time qPCR. The data are representative of five independent experiments performed using two different UCB samples and represent the mean values ± S.E.M. of duplicates.
Figure 4
Figure 4. Possible involvement of microRNAs in IL2Rγ expression during human NK cell differentiation.
Isolated CB HPCs (CD34+Lin cells) were cultured as described in the Materials and Methods. After being cultured in IL-15-supplemented media, the cells were collected at 48 h intervals. (a) The expression of the IL2Rγ gene was analyzed by real-time quantitative RT-PCR. (b) The expression of IL2Rγ protein was analyzed by FACS. (c) Expression profiling of IL2Rγ, miR-583 and miR-143 after IL-15 treatment. The data are representative of three independent experiments performed using five different UCB samples and represent the mean values ± S.E.M. of duplicates.
Figure 5
Figure 5. Human miR-583 downregulates NK cell differentiation.
(a) Differentiating cells were transfected with miR-143, a miR-583 mimic or negative control miRNA. NK cell populations (CD56+CD3 cells) were analyzed by FACS 10 days after transfection. *, p<0.1. (b) The expression level of miR-583 was decreased during NK cell development as shown by qRT-PCR. The results are shown as the mean expression values normalized against stage 2 (CD34+CD117+CD94). *, p<0.1. (c) NK cell populations (CD56+CD3 cells) were analyzed by FACS after miR-583 transfection at regular intervals during NK cell differentiation. The absolute numbers of differentiated NK cells are shown in the parentheses (×105). *, p<0.01 **, p<0.001. The data are representative of three independent experiments performed using three different UCB samples and represent the mean values ± S.E.M. of duplicates.
Figure 6
Figure 6. Human miR-583 downregulates NK cell activation by silencing IL2Rγ during NK cell differentiation.
(a) The expression of IL2Rγ was analyzed by FACS 14 days after miR-control or miR-583 transfection in differentiating NK cells and CD56+CD3 gated NK cells. Gray, IgG control; blue, miR-control; red, miR-583. The absolute numbers of differentiated NK cells are shown in the parentheses (×105). (b) The expression of p-STAT5 was analyzed by FACS 7 days after miR-control or miR-583 transfection in differentiating NK cells. Gray, IgG control; blue, miR-control; red, miR-583. (c) The expression levels of NK cell activation receptors in differentiating NK cells and CD56+CD3 gated NK cells were analyzed by FACS 14 days after miR-control or miR-583 transfection. Gray, IgG control; blue, miR-control; red, miR-583. (d). Cytotoxicity of differentiating NK cells was determined by 51Cr release assay against K562 cells at the indicated effector/target (E:T) ratios. *, p<0.1. The expression levels of CD107a in differentiating NK cells and CD56+CD3 gated NK cells were analyzed by FACS. Gray, IgG control; blue, miR-control; red, miR-583. (e) Differentiating NK cells were stimulated with PMA/IO or IL-18. After 16 h, the supernatants were assayed for IFN-γ production by ELISA. *, p<0.1. Values represent the mean % of positive cells ± S.E.M. of triplicates. The data are representative of three independent experiments performed using three different UCB samples and represent the mean values ± S.E.M. of duplicates.
Figure 7
Figure 7. Human miR-583 specifically targets IL2Rγ 3′ UTR sequences.
(a) Predicted miR-583 binding sites. Mutants (M). Point mutations are in bold. Numbers indicate the positions of nucleotides in the 3′ UTR. (b) Reporter assay using immunoblotting (IB) analysis. HEK-293FT cells were cotransfected with combinations of reporter plasmids containing IL2Rγ 3′ UTRs and miR-583 or mutant miR-583 (miR-583 M). Reporter AANAT mRNA levels were normalized to Neo mRNA levels as an internal control for the vector. The net amount of translated AANAT protein was determined by IB. GAPDH served as a loading control. The data are representative of two independent experiments (mean values ± S.E.M. of triplicates).

Similar articles

Cited by

References

    1. Di Santo JP (2006) Natural killer cell developmental pathways: a question of balance. Annu Rev Immunol 24: 257–286. - PubMed
    1. Galy A, Travis M, Cen D, Chen B (1995) Human T, B, natural killer, and dendritic cells arise from a common bone marrow progenitor cell subset. Immunity 3: 459–473. - PubMed
    1. Blom B, Spits H (2006) Development of human lymphoid cells. Annu Rev Immunol 24: 287–320. - PubMed
    1. Freud AG, Yokohama A, Becknell B, Lee MT, Mao HC, et al. (2006) Evidence for discrete stages of human natural killer cell differentiation in vivo. J Exp Med 203: 1033–1043. - PMC - PubMed
    1. Boggs SS, Trevisan M, Patrene K, Geogopoulos K (1998) Lack of natural killer cell precursors in fetal liver of Ikaros knockout mutant mice. Nat Immun 16: 137–145. - PubMed

Publication types

MeSH terms