. 2014 Oct 14;9(10):e110365.
doi: 10.1371/journal.pone.0110365. eCollection 2014.

L-Endoglin overexpression increases renal fibrosis after unilateral ureteral obstruction

Affiliations

L-Endoglin overexpression increases renal fibrosis after unilateral ureteral obstruction

Bárbara Oujo et al. PLoS One. .

Abstract

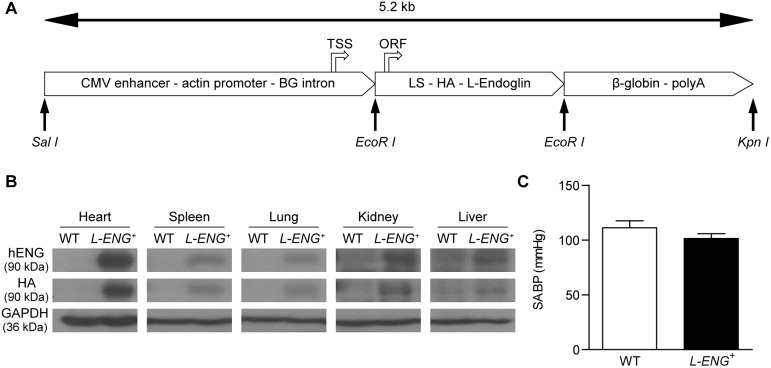
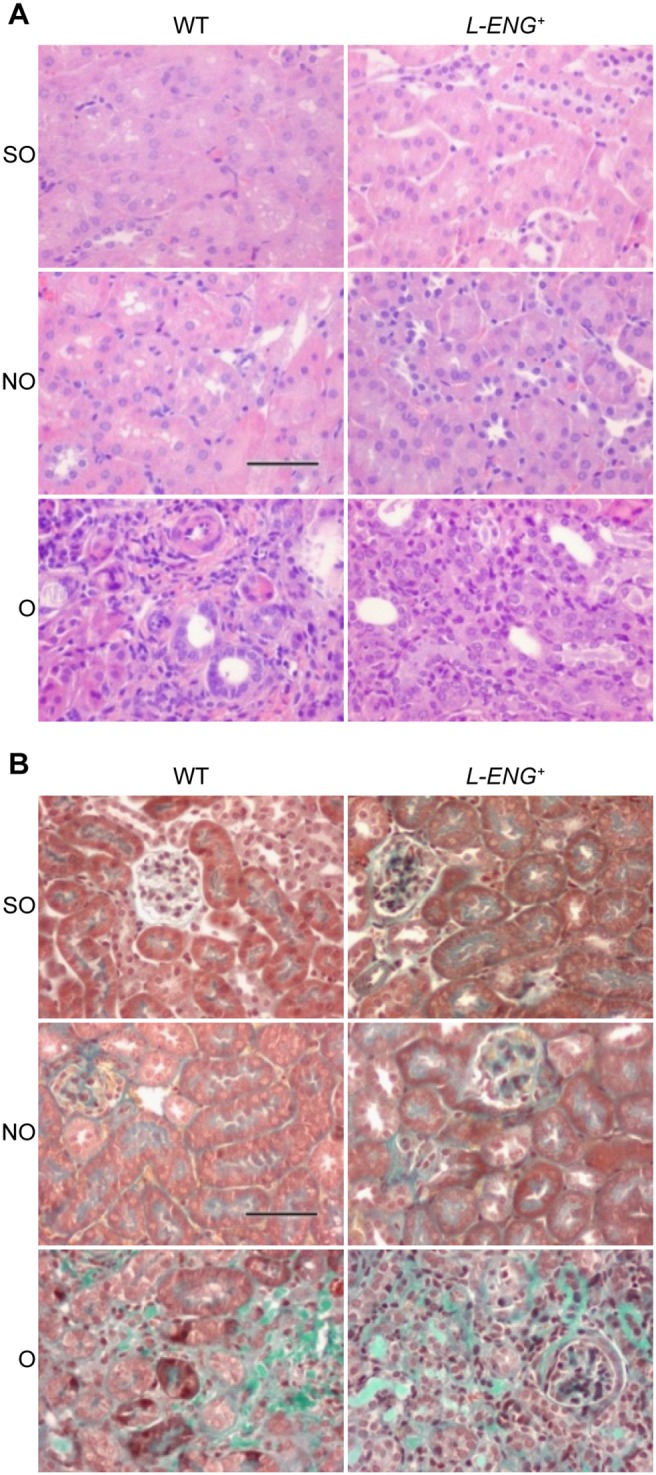
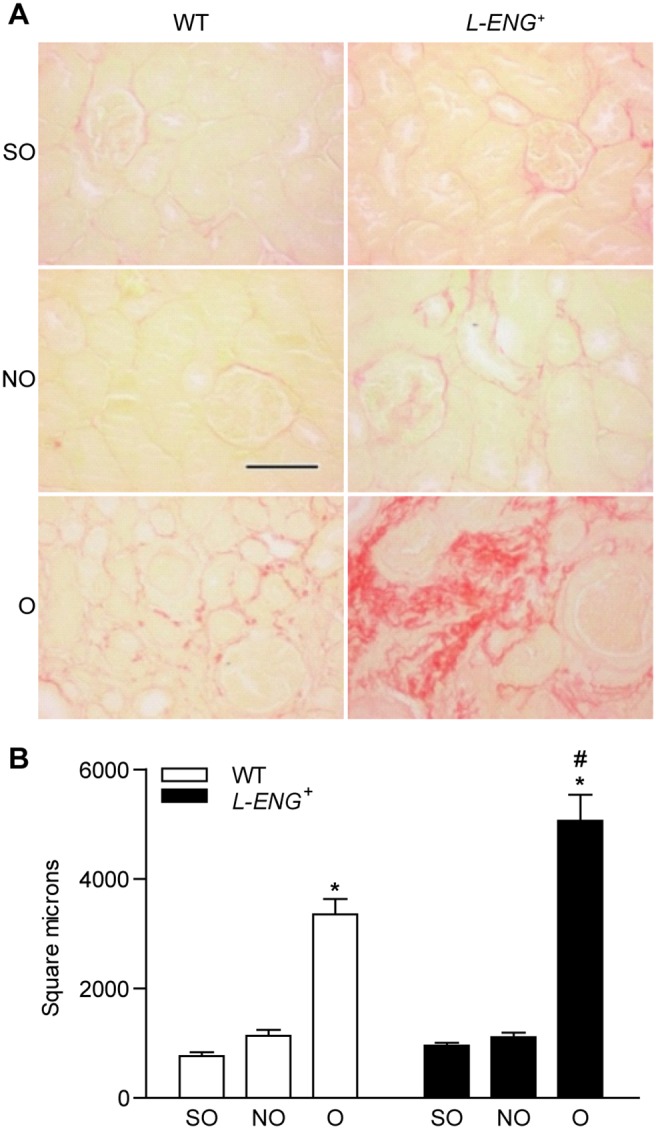
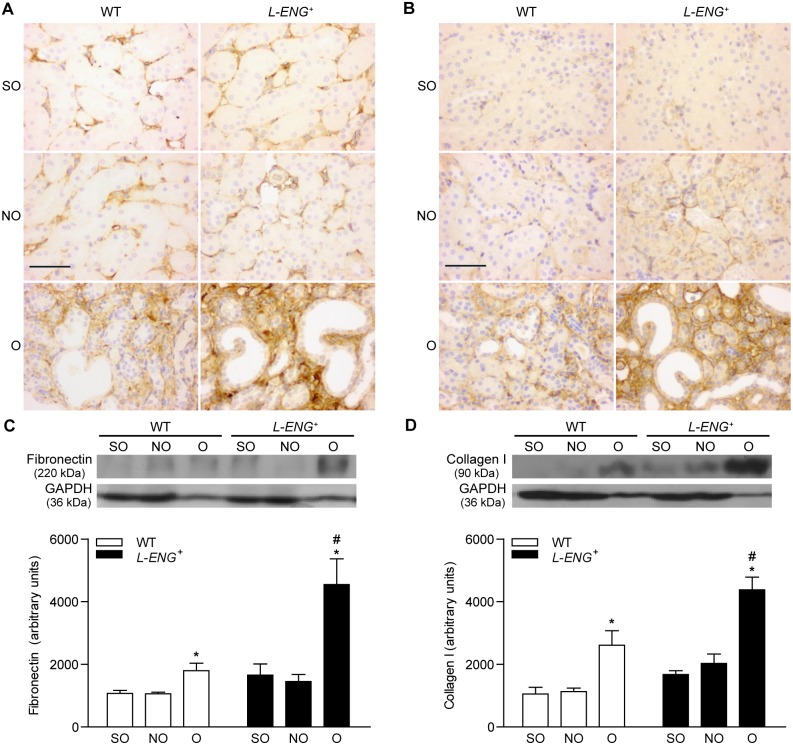
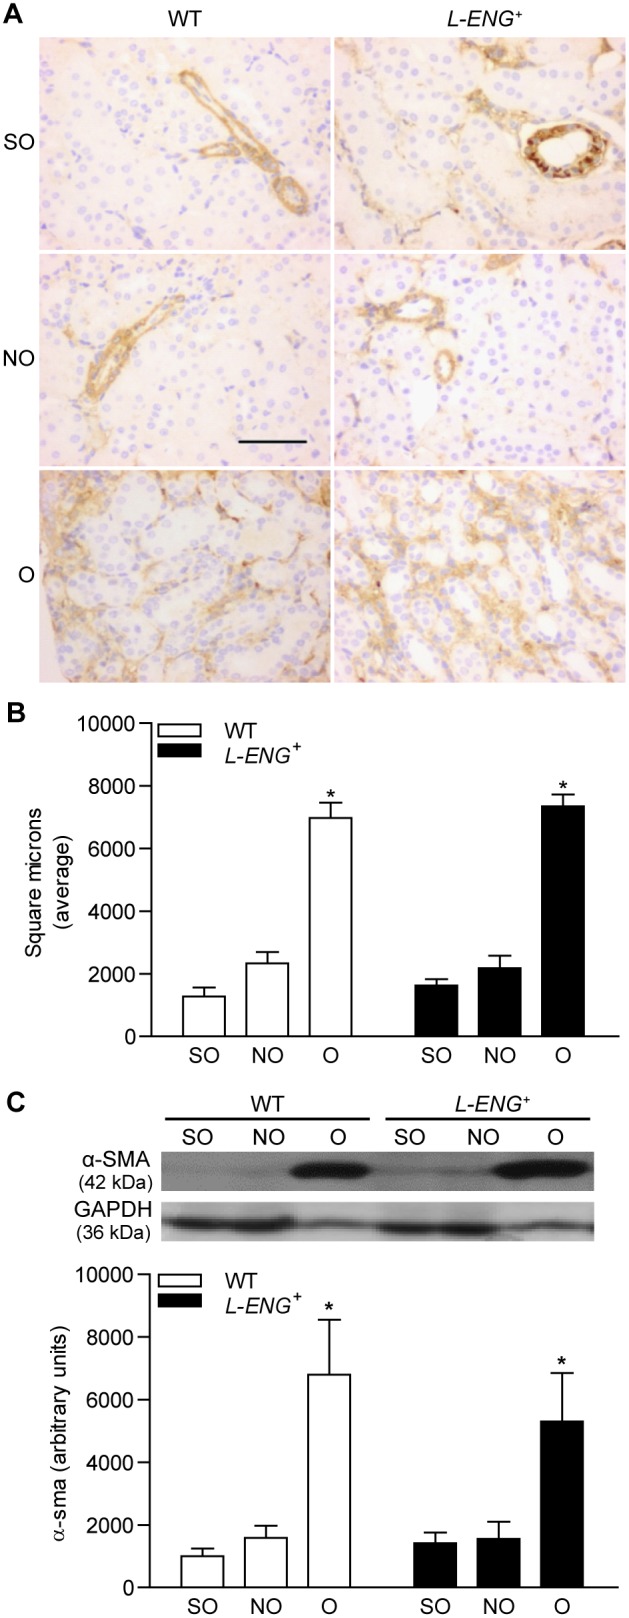
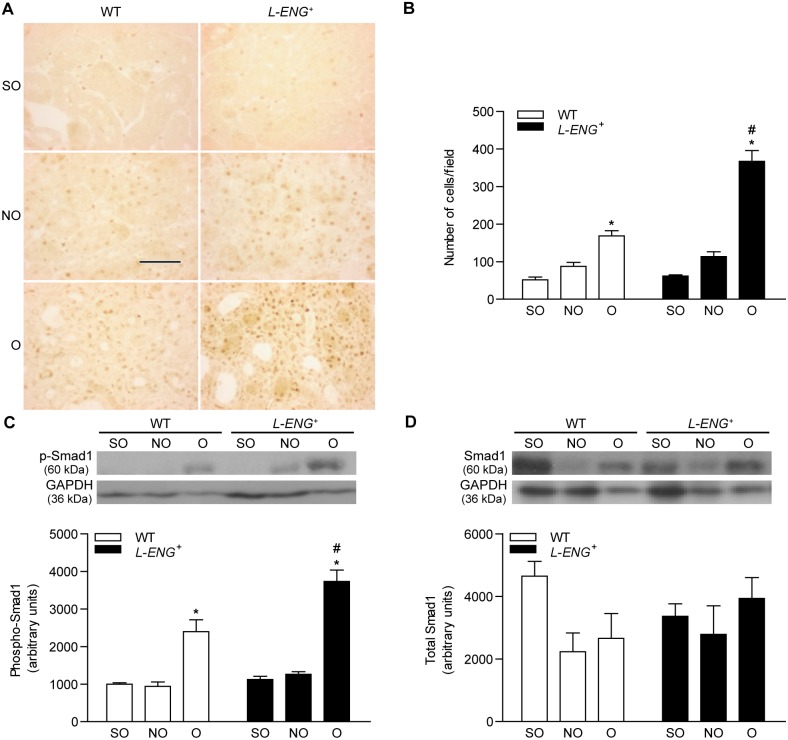
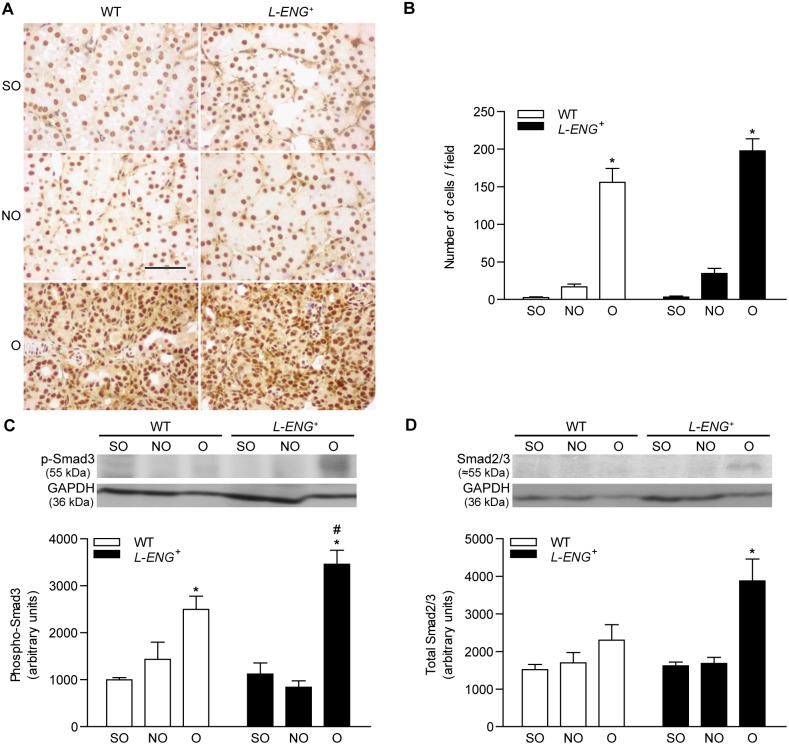
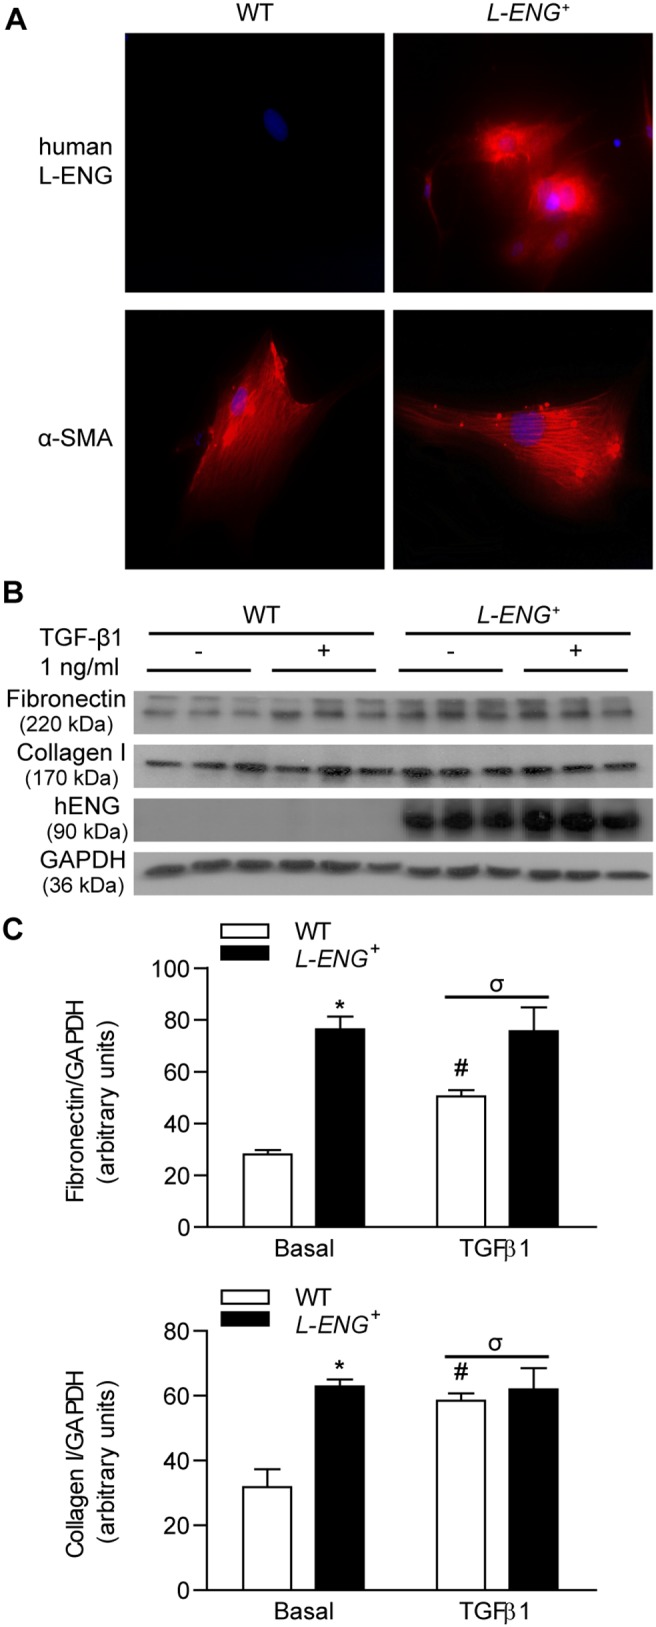
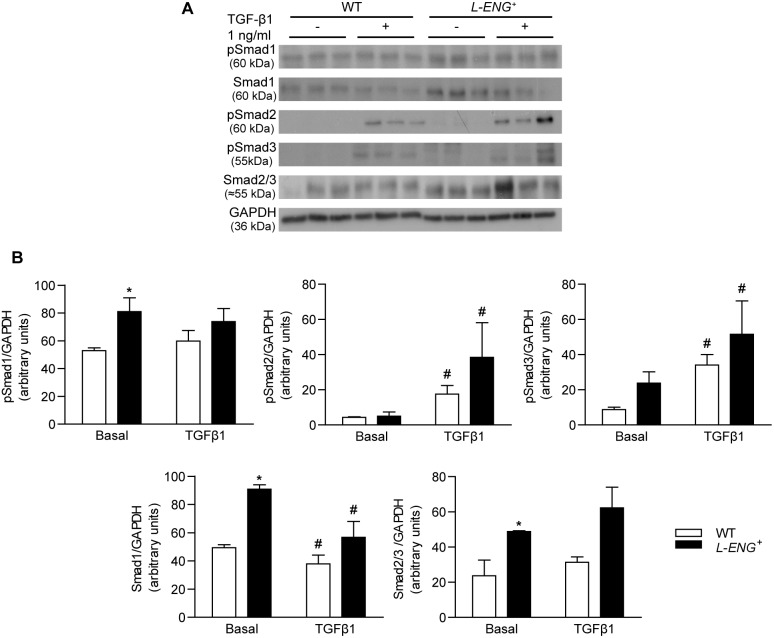
Transforming growth factor-β (TGF-β) plays a pivotal role in renal fibrosis. Endoglin, a 180 KDa membrane glycoprotein, is a TGF-β co-receptor overexpressed in several models of chronic kidney disease, but its function in renal fibrosis remains uncertain. Two membrane isoforms generated by alternative splicing have been described, L-Endoglin (long) and S-Endoglin (short) that differ from each other in their cytoplasmic tails, being L-Endoglin the most abundant isoform. The aim of this study was to assess the effect of L-Endoglin overexpression in renal tubulo-interstitial fibrosis. For this purpose, a transgenic mouse which ubiquitously overexpresses human L-Endoglin (L-ENG+) was generated and unilateral ureteral obstruction (UUO) was performed in L-ENG+ mice and their wild type (WT) littermates. Obstructed kidneys from L-ENG+ mice showed higher amounts of type I collagen and fibronectin but similar levels of α-smooth muscle actin (α-SMA) than obstructed kidneys from WT mice. Smad1 and Smad3 phosphorylation were significantly higher in obstructed kidneys from L-ENG+ than in WT mice. Our results suggest that the higher increase of renal fibrosis observed in L-ENG+ mice is not due to a major abundance of myofibroblasts, as similar levels of α-SMA were observed in both L-ENG+ and WT mice, but to the higher collagen and fibronectin synthesis by these fibroblasts. Furthermore, in vivo L-Endoglin overexpression potentiates Smad1 and Smad3 pathways and this effect is associated with higher renal fibrosis development.


Conflict of interest statement

Competing Interests: The authors have declared that no competing interests exist.

Figures

Figure 1
Figure 1. Transgenic mice expressing human L-endoglin.
(a) Schematic representation of the DNA construct used to generate transgenic mice expressing human L-endoglin. A 5.2-kb SalI/KpnI fragment, containing a CMV enhancer, an actin enhancer/promoter, a β-globin (BG) intron (fragment SalI/EcoRI), the endoglin leader sequence-LS, the hemagglutinin epitope-HA, the human L-endoglin cDNA (fragment EcoRI/EcoRI) and a β-globin polyadenylation site-polyA (fragment EcoRI/KpnI), was microinjected in the pronuclei of fertilized oocytes to generate L-ENG + mice. The transcription start site (TSS) and the translation initiation of the open reading frame (ORF) are indicated. (b) Expression of human L-endoglin protein in different tissues from L-ENG + mice. Protein extracts were analyzed by western blot using anti-endoglin and anti-HA antibodies. (c) Effects of human L-endoglin overexpression in systolic arterial blood pressure (SABP). N = 12 mice per group.
Figure 2
Figure 2. Effect of L-Endoglin overexpression on interstitial fibrosis after unilateral ureteral obstruction (I).
Representative images of haematoxylin-eosin (a) and Masson’s trichrome (b) staining in sham operated (SO), non-obstructed (NO) and obstructed (O) kidneys from WT and L-ENG + mice. In O kidneys tubular dilatation, inflammatory cell infiltration and interstitial fibrosis can be observed. Bar = 100 µm.
Figure 3
Figure 3. Effect of L-Endoglin overexpression on interstitial fibrosis after unilateral ureteral obstruction (II).
(a) Representative images of Sirius Red staining in sham operated (SO), non-obstructed (NO) and obstructed (O) kidneys from WT and L-ENG + mice. Bar = 100 µm. (b) Morphometric quantification (mean ± SEM) of area stained by Sirius Red; SO (n = 3); NO (n = 4); O (n = 4) in each group of mice. *P<0.05 vs. their respective SO kidneys. #P<0.05 vs. O kidneys from WT mice.
Figure 4
Figure 4. Effect of L-Endoglin overexpression on fibronectin and collagen I expression following ureteral obstruction.
Representative immunohistochemistry images for fibronectin (a) and collagen I (b) in sham operated (SO), non-obstructed (NO) and obstructed (O) kidneys from WT and L-ENG + mice. Bar = 100 µm. Western blot analysis of fibronectin (c) and collagen I (d) protein amount in SO, NO and O kidneys from WT and L-ENG+ mice. A representative western blot among 5–7 performed in each group is shown on top. Densitometry analysis is represented as the mean ± SEM of the 5–7 western performed per group. *P<0.01 vs. SO kidneys. #P<0.05 vs. O kidneys from WT mice.
Figure 5
Figure 5. Effect of L-Endoglin overexpression on myofibroblast abundance following ureteral obstruction.
Representative immunohistochemistry images for α-SMA (a) in sham operated (SO), non-obstructed (NO) and obstructed (O) kidneys from WT and L-ENG + mice. Bar = 100 µm. (b) Quantification of α-SMA-positive stained area in sham operated (SO), non-obstructed (NO) and obstructed (O) kidneys from WT and L-ENG + mice, expressed as square microns. (c) Western blot analysis of α-SMA protein amount in SO, NO and O kidneys from WT and L-ENG+ mice. A representative western blot among 5–7 performed in each group is shown on top. Densitometry analysis is represented as the mean ± SEM of the 5–7 western performed per group. *P<0.01 vs. SO kidneys. #P<0.05 vs. O kidneys from WT mice.
Figure 6
Figure 6. Effect of L-Endoglin overexpression on Smad1 and phospho-Smad1 expression following ureteral obstruction.
(a) Representative immunohistochemistry images for phospho-Smad1 in sham operated (SO), non-obstructed (NO) and obstructed (O) kidneys from WT and L-ENG + mice. Bar = 100 µm. (b) Histogram representing the number of phospho-Smad1-positive nuclei per field in SO, NO and O kidneys from WT and L-ENG + mice. Data is represented as mean ± SEM. Western blot analysis of phospho-Smad1 (c) and total Smad1 (d) protein amount in SO, NO and O kidneys from WT and L-ENG + mice. A representative western blot among 5–7 performed in each group is shown on top. Densitometry analysis is represented as the mean ± SEM of the 5–7 western performed per group. *P<0.01 vs. SO kidneys. #P<0.05 vs. O kidneys from WT mice.
Figure 7
Figure 7. Effect of L-Endoglin overexpression on Smad2/3 and phospho-Smad3 expression following ureteral obstruction.
(a) Representative immunohistochemistry images for phospho-Smad3 in sham operated (SO), non-obstructed (NO) and obstructed (O) kidneys from WT and L-ENG + mice. Bar = 100 µm. (b) Histogram representing number of nuclei positively stained for phospho-Smad3 per field in SO, NO and O kidneys from WT and L-ENG + mice. Data is represented as mean ± SEM. Western blot analysis of phospho-Smad3 (c) and total Smad2/3 (d) protein amount in SO, NO and O kidneys from WT and L-ENG + mice. A representative western blot among 5–7 performed in each group is shown on top. Densitometry analysis is of the 5–7 western performed per group. *P<0.01 vs. SO kidneys. #P<0.05 vs. O kidneys from WT mice.
Figure 8
Figure 8. Effect of L-Endoglin overexpression on ECM synthesis in renal fibroblasts.
(a) Immunofluorescence of human L-Endoglin and α-SMA in WT and L-ENG + renal fibroblasts. Magnification, 1,000X. Note the presence of human L-endoglin only in L-ENG+ renal fibroblasts. (b) Effect of L-Endoglin on ECM protein levels in renal fibroblasts. Representative western blot analysis of fibronectin, collagen I, human L-Endoglin and GAPDH proteins in WT and L-ENG + renal fibroblasts under basal conditions and after TGF-β1 (1 ng/mL) treatment for 24 hours. Densitometric analysis is represented as the mean ± SEM. *P<0.01 vs. WT fibroblasts in basal conditions. #P<0.05 for TGF-β1 treatments vs. basal conditions. σP<0.05 for TGF-β1 treatment in L-ENG + vs. TGF-β1 treatment in WT fibroblasts.
Figure 9
Figure 9. Effect of L-Endoglin overexpression on TGF-β1/Smad signalling in renal fibroblasts.
(a) Representative western blot analysis of phospho-Smad1, phospho-Smad2, phospho-Smad3, Smad2/3, Smad1 and GAPDH protein expression in WT and L-ENG + renal fibroblasts under basal conditions and after TGF-β1 (1 ng/mL) treatment for 30 minutes. (b) Densitometric analysis is represented as the mean ± SEM. *P<0.01 vs. WT fibroblasts in basal conditions. #P<0.05 for TGF-β1 treatment vs. basal conditions.

References

    1. Grande MT, Lopez-Novoa JM (2009) Fibroblast activation and myofibroblast generation in obstructive nephropathy. Nat Rev Nephrol 5: 319–328. - PubMed
    1. Border WA, Okuda S, Languino LR, Ruoslahti E (1990) Transforming growth factor-beta regulates production of proteoglycans by mesangial cells. Kidney Int 37: 689–695. - PubMed
    1. Bitzer M, Sterzel RB, Bottinger EP (1998) Transforming growth factor-beta in renal disease. Kidney Blood Press Res 21: 1–12. - PubMed
    1. Lebrin F, Deckers M, Bertolino P, Ten Dijke P (2005) TGF-beta receptor function in the endothelium. Cardiovasc Res 65: 599–608. - PubMed
    1. Moon JA, Kim HT, Cho IS, Sheen YY, Kim DK (2006) IN-1130, a novel transforming growth factor-beta type I receptor kinase (ALK5) inhibitor, suppresses renal fibrosis in obstructive nephropathy. Kidney Int 70: 1234–1243. - PubMed

Publication types

MeSH terms