. 2014 Oct 14;9(10):e108468.
doi: 10.1371/journal.pone.0108468. eCollection 2014.

MicroRNA-223-3p inhibits the angiogenesis of ischemic cardiac microvascular endothelial cells via affecting RPS6KB1/hif-1a signal pathway

Affiliations

MicroRNA-223-3p inhibits the angiogenesis of ischemic cardiac microvascular endothelial cells via affecting RPS6KB1/hif-1a signal pathway

Guo-Hua Dai et al. PLoS One. .

Abstract

Background: MicroRNAs (miRNAs) are a recently discovered class of posttranscriptional regulators of gene expression with critical functions in the angiogenesis and cardiovascular diseases; however, the details of miRNAs regulating mechanism of angiogenesis of ischemic cardiac microvascular endothelial cells (CMECs) are not yet reported.

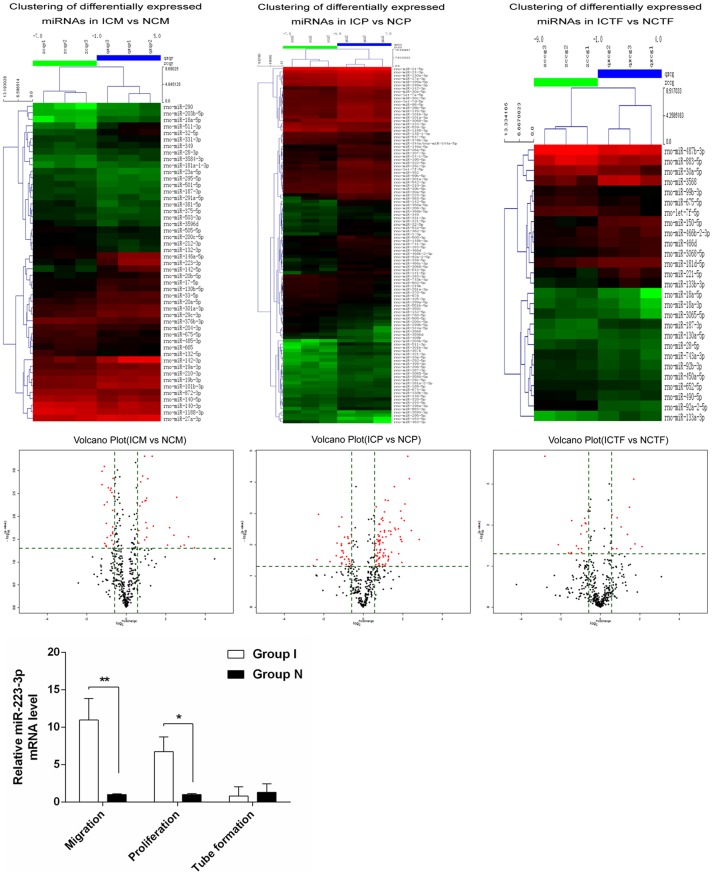
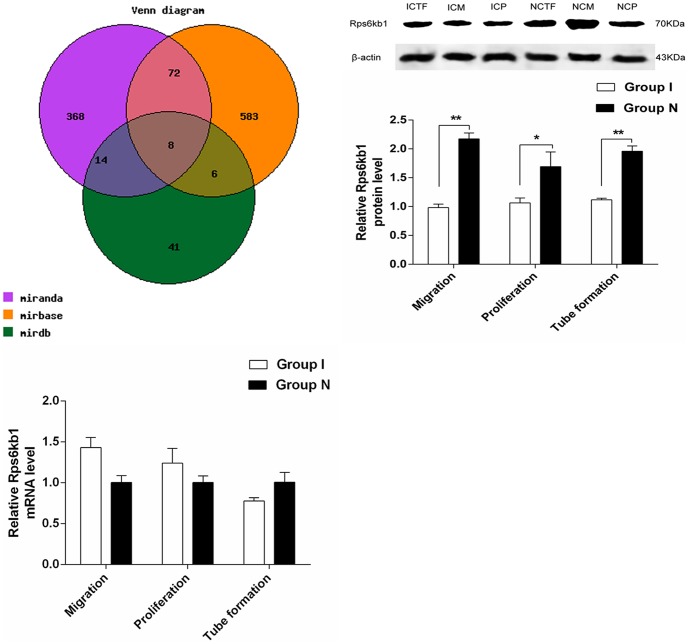
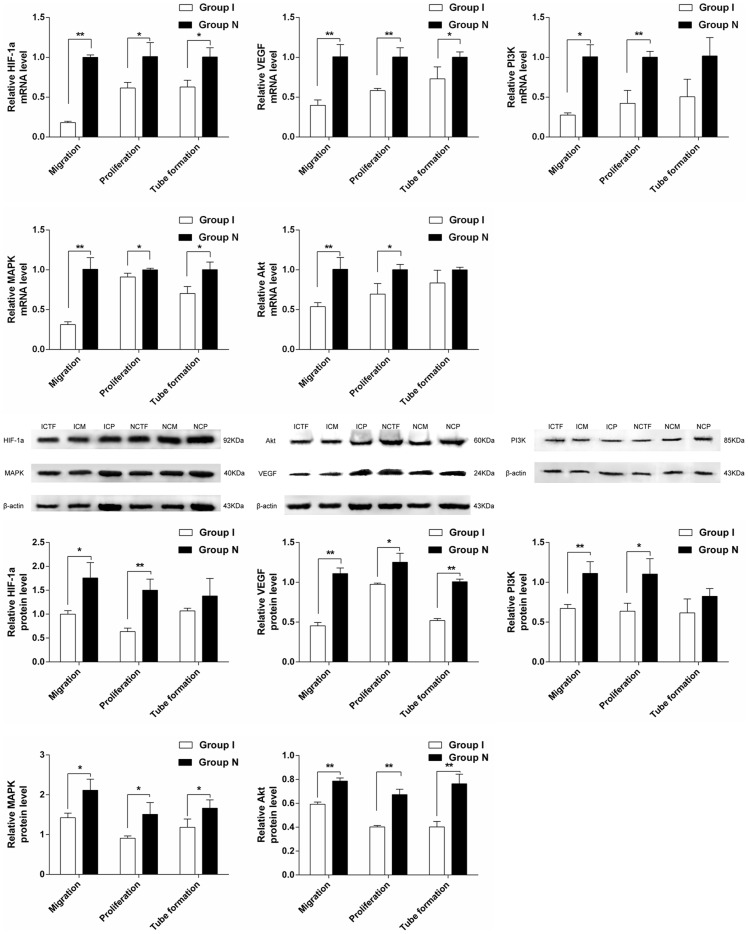
Methods and results: This study analyzes the changes of the dynamic expression of miRNAs during the process of angiogenesis of ischemic CMECs by applying miRNA chip and real-time PCR for the first time. Compared with normal CMECs, ischemic CMECs have a specific miRNAs expression profile, in which mir-223-3p has the most significant up-regulation, especially during the process of migration and proliferation, while the up-regulation is the most significant during migration, reaching 11.02 times. Rps6kb1 is identified as a potential direct and functional target of mir-223-3p by applying bioinformatic prediction, real-time PCR and Western blot. Pathway analysis report indicates Rps6kb1 regulates the angiogenesis by participating into hif-1a signal pathway. Further analysis reveals that both the gene and protein expression of the downstream molecules VEGF, MAPK, PI3K and Akt of Rps6kb1/hif-1a signal pathway decrease significantly during the process of migration and proliferation in the ischemic CMECs. Therefore, it is confirmed that mir-223-3p inhibits the angiogenesis of CMECs, at least partly, via intervening RPS6KB1/hif-1a signal pathway and affecting the process of migration and proliferation.

Conclusion: This study elucidates the miRNA regulating law in the angiogenesis of CMECs; mir-223-3p inhibits the process of migration and proliferation of ischemic CMECs probably via affecting RPS6KB1/hif-1a signal pathway, which in turn suppresses the angiogenesis. It is highly possible that mir-223-3p becomes a novel intervention core target in the treatment of angiogenesis of ischemic heart diseases.


Conflict of interest statement

Competing Interests: The authors have declared that no competing interests exist.

Figures

Figure 1
Figure 1
A. Left: a normal electrocardiogram or rat before the model building. Right: After the model building, electrocardiograms lead II indicated ST segment elevated significantly, which indicated ischemia myocardial and proved the artery ligation was successful. B. The cells were in the shape of stars or polygons when they initially disassociated out of the tissue block and had a low density, they were in the shape of paving stones when the cells bespreaded the bottom of the culture flask, in some of which tube structure and vessel network structure could be spotted. C. Immunocytochemical stain revealed that: (left) after the staining of VIII factor, the cytoplasm was brown coloring, the coloring was the most significant in pericaryon; (right) after the staining of CD31, their cell membrane showed yellowish brown particles, which proved that the cultured cells were CMECs.
Figure 2
Figure 2
A. The OD value of normal CMECs exceeded that of ischemic CMECs, the normal CMECs proliferated vigorously on the third day while the cell growth curve of ischemic CMECs was even, the OD value reached a peak till the sixth day. B. A dynamic observation revealed that the proliferating phase of the normal CMECs was the third day while the proliferating phase of the ischemic CMECs was the sixth day. The cell proliferation ratio of ischemic CMECs decreased significantly compared with that of the normal CMECs (P<0.05).
Figure 3
Figure 3
A. Under microscope, for normal CMECs, a clear scratching blank area could be spotted after the scratching test. The blank area decreased significantly with amount of cells crossed the scratching line one day later. The blank area was gradually covered with increasing proliferated cells two days later. The blank area was completely covered with proliferated cells three days later. For ischemic CMECs, a similar scratching blank area could also be spotted after the scratching test. The blank area could still be clearly spotted one day later because there was only a small amount of cell migrated to the blank area. The migrated cells increased two days later, but were still less than that of normal CMECs. The migrated cells increased three days later, but the blank area could still be spotted. B. A dynamic observation revealed that the cell migration ratio of ischemic CMECs decreased significantly compared with that of the normal CMECs (P<0.01).
Figure 4
Figure 4
A. For normal CMECs, observation under inverted phase contrast microscope (100×) revealed that amounts of “C”-shaped tube structure were formed one day after inoculation. The “C”-shaped tube structures were clearer and increased significantly two days after inoculation. The “C”-shaped tube structure decreased with an increased cell number three days after inoculation. The “C”-shaped tube structure further decreased four days after inoculation. For ischemic CMECs, there was no obvious tube formation one day after inoculation, only several “C”-shaped structure were spotted under inverted phase contrast microscope (100×). Several tube formations were spotted two days after inoculation, of which the number was less than that of normal CMECs. The tube structure decreased with an increased cell number three days after inoculation. The tube structure disappeared four days after inoculation. B. A dynamic observation revealed that the migration phase of normal/ischemic CMECs was the second day. Tube formation ratio of ischemic CMECs decreased compared with that of the normal CMECs, but that was of no statistical significance.
Figure 5
Figure 5. MicroRNA expression profiling in ischemic CMECs proliferation(ICP), ischemic CMECs tube formation (ICTF)and ischemic CMECs migration (ICM)compared with that of normal CMECs proliferation(NCP), normal CMECs tube formation (NCTF) and normal CMECs migration (NCM).
A. Differentially expressed miRNAs in ICP(n = 3), ICTF(n = 3) and ICM(n = 3) compared with NCP(n = 3), NCTF(n = 3) and NCM(n = 3). The heat map diagram showed the result of the two-way hierarchical clustering of miRNAs and samples. Each row represented a miRNA and each column representsed a sample. The miRNA clustering tree was shown on the left, and the sample clustering tree appeared at the top. The color scale shown at the top illustrated the relative expression level of a miRNA in the certain slide: red color represented a high relative expression level; green color represented a low relative expression levels. n = 3 in each group. B. Volcano Plots were useful tool for visualizing differential expression between two different conditions. They were constructed using fold-change values and p-values, and thus allowing visualizing the relationship between fold-change (magnitude of change) and statistical significance (which took both magnitude of change and variability into consideration). They also allowed subsets of genes to be isolated, based on those values. The vertical lines corresponded to 1.5-fold up and down, respectively, and the horizontal line represented a p-value of 0.05. So the red point in the plot represented the differentially expressed miRNAs with statistical significance. C. Confirmation of mir-223-3p in the same set of samples as used in microarray assay by means of real-time PCR. ΔCt values were normalized to U6 levels. Relative expression was calculated with respect to normal CMECs. The results were expressed as Log10 (2∧−ΔΔCt). *P<0.05, **P<0.01.
Figure 6
Figure 6. Rps6kb1 was determined as the direct and functional target of mir-223-3p.
A. The Venn diagram displayed the overlap between three databases. B. Western blot analyzed the protein level of Rps6kb1 in ICM, ICP and ICTF when compared to that of NCM, NCP and NCTF. β-actin was used as internal controls. (C)Real-time PCR analysis showed no significant difference in RPS6KB1 mRNA expression in ICM, ICP and ICTF when compared to that of NCM, NCP and NCTF. *P<0.05, **P<0.01.
Figure 7
Figure 7. Mir-223-3p inhibited proliferation and migration via affecting RPS6KB1/hif-1a signal pathway.
A. Real-time PCR analyzed the mRNA level of hif-1a, VEGF, MAPK, PI3K, Akt in ICM, ICP and ICTF when compared to that of NCM, NCP and NCTF. B. Western blot analyzes the protein level of hif-1a, VEGF, MAPK, PI3K, Akt in ICM, ICP and ICTF when compared to that of NCM, NCP and NCTF. β-actin was used as internal controls. *P<0.05, **P<0.01.

Similar articles

Cited by

References

    1. Han YC, Park CY, Bhagat G, Zhang J, Wang Y, et al. (2010) MicroRNA-29a induces aberrant self-renewal capacity in hematopoietic progenitors, biased myeloid development, and acute myeloid leukemia. J Exp Med 207 3: 475–489. - PMC - PubMed
    1. Qin W, Shi Y, Zhao B, Yao C, Jin L, et al. (2010) MiR-24 regulates apoptosis by targeting the open reading frame (ORF) region of FAF1 in cancer cells. PLoS ONE 5 2: e9429. - PMC - PubMed
    1. Tie J, Pan Y, Zhao L, Wu K, Liu J, et al. (2010) MiR-218 inhibits invasion and metastasis of gastric cancer by targeting the Robo1 receptor. PLoS Genet 6 3: e1000879. - PMC - PubMed
    1. Filipowicz W, Bhattacharyya SN, Sonenberg N (2008) Mechanisms of post-transcriptional regulation by microRNAs: are the answers in sight. Nat Rev Genet 9 2: 102–114. - PubMed
    1. Lewis BP, Burge CB, Bartel DP (2005) Conserved seed pairing, often flanked by adenosines, indicates that thousands of human genes are microRNA targets. Ceel 120 1: 15–20. - PubMed

Publication types

MeSH terms