. 2014 Oct 14;12(10):e1001969.
doi: 10.1371/journal.pbio.1001969. eCollection 2014 Oct.

A conserved endoplasmic reticulum membrane protein complex (EMC) facilitates phospholipid transfer from the ER to mitochondria

Affiliations

A conserved endoplasmic reticulum membrane protein complex (EMC) facilitates phospholipid transfer from the ER to mitochondria

Sujoy Lahiri et al. PLoS Biol. .

Abstract

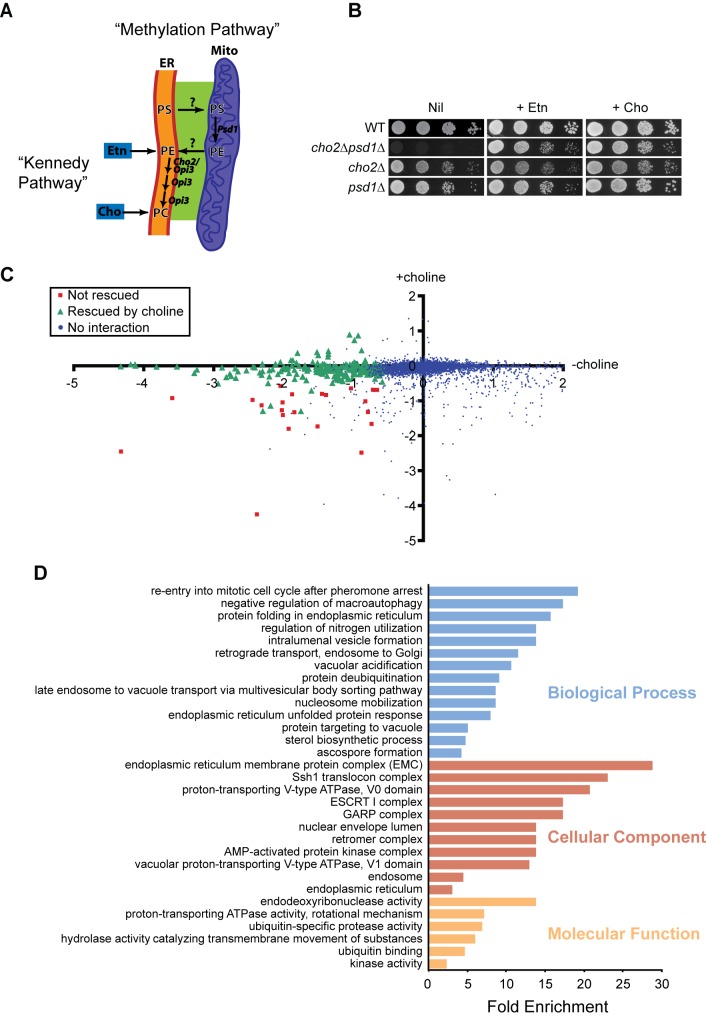
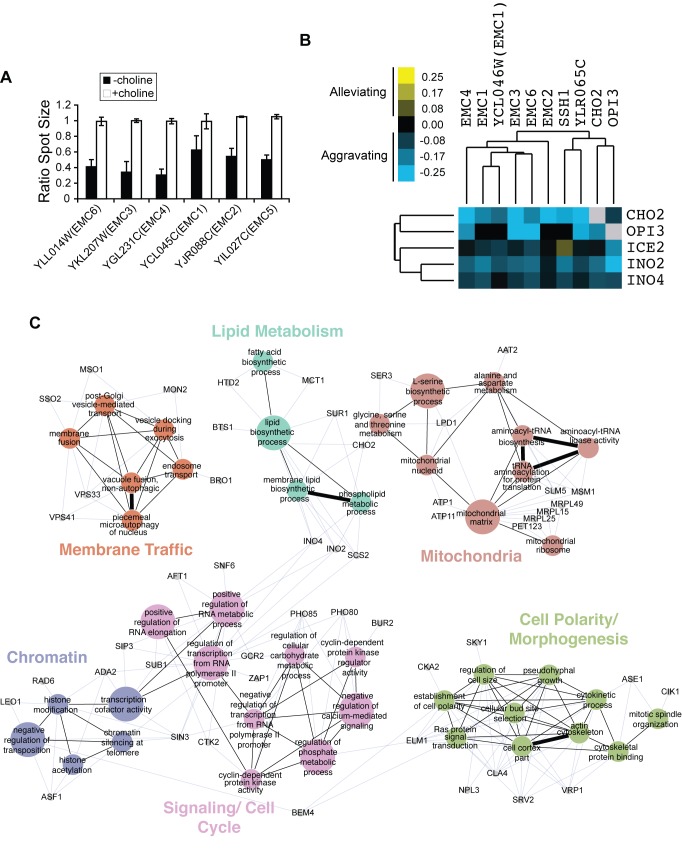
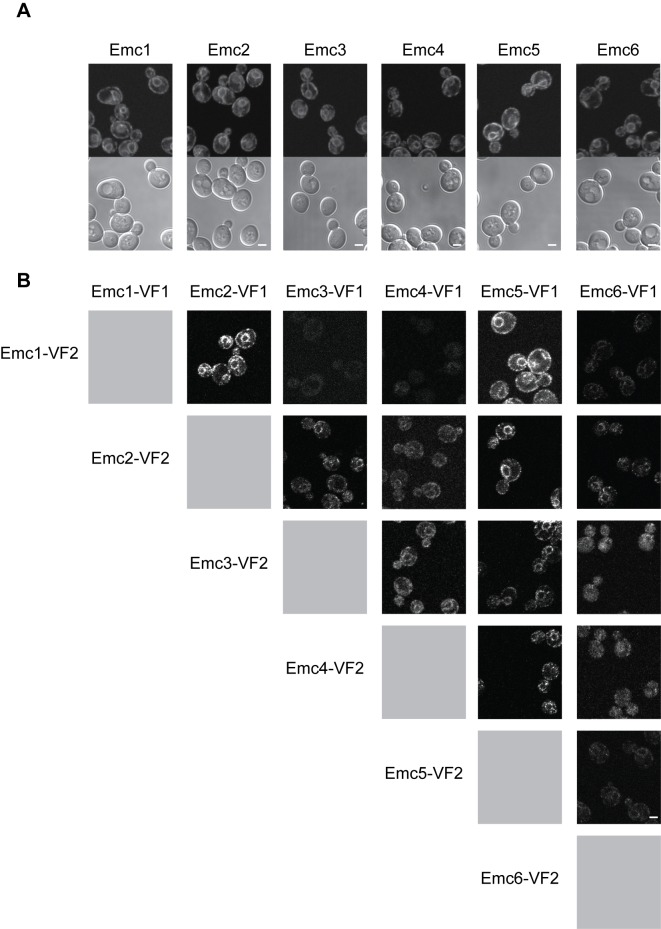
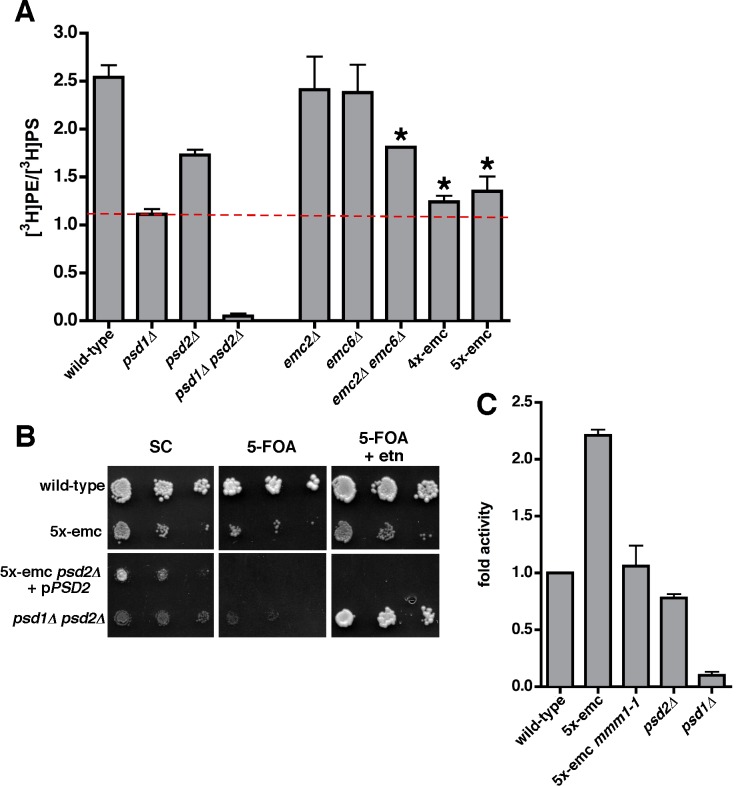
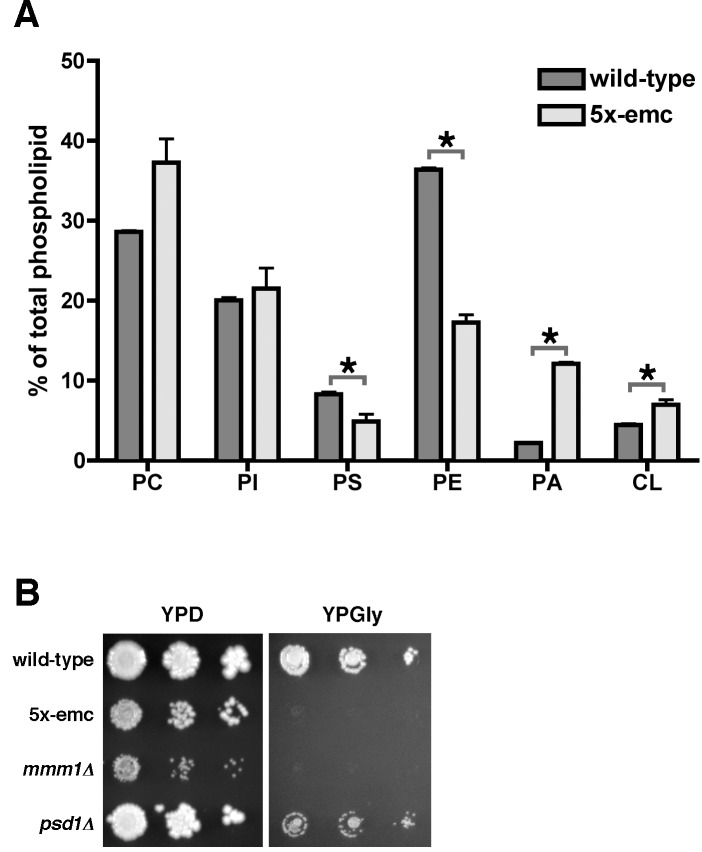
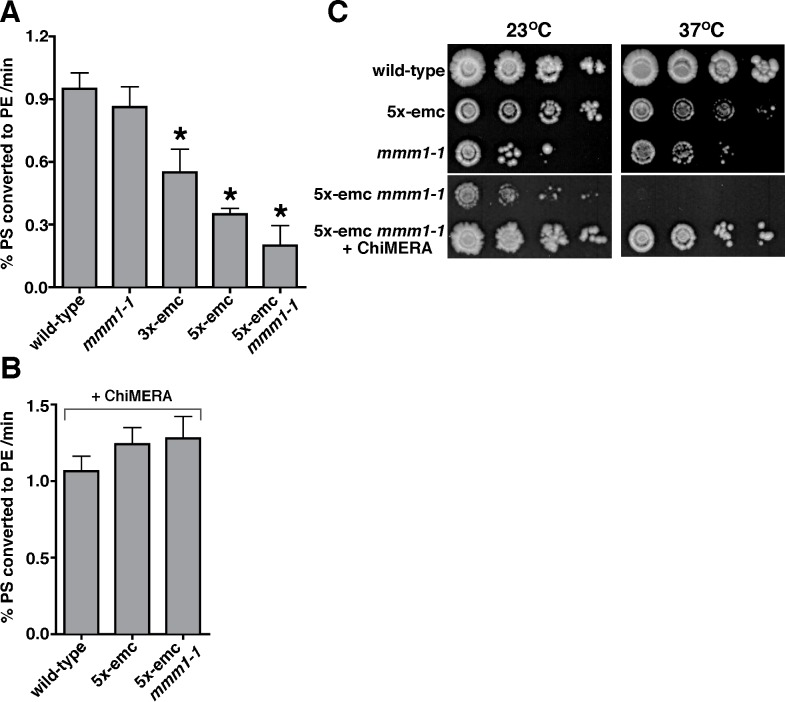
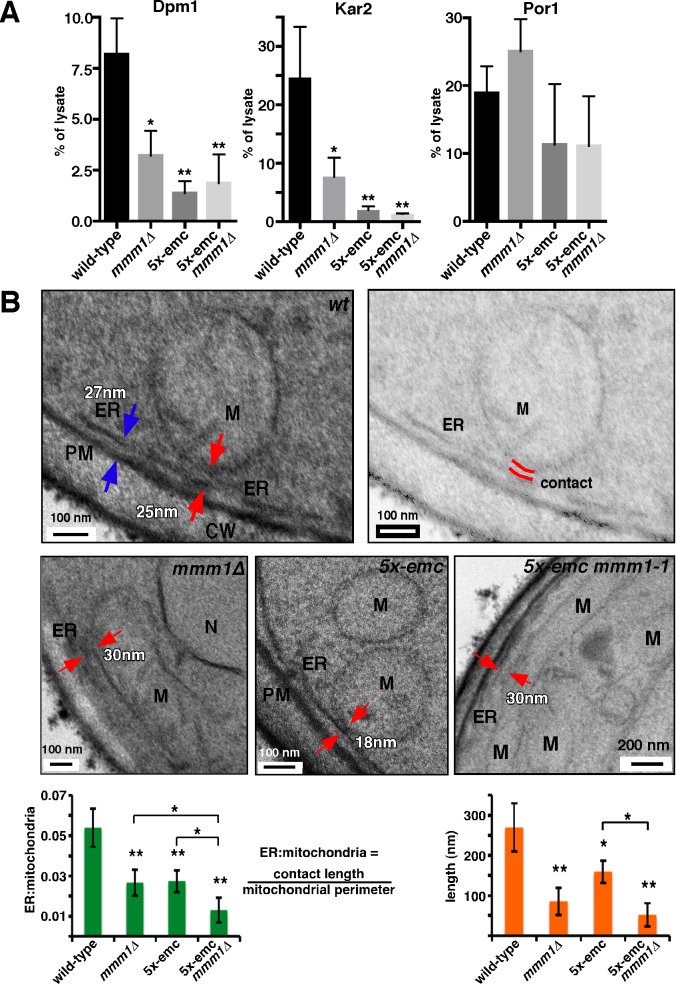
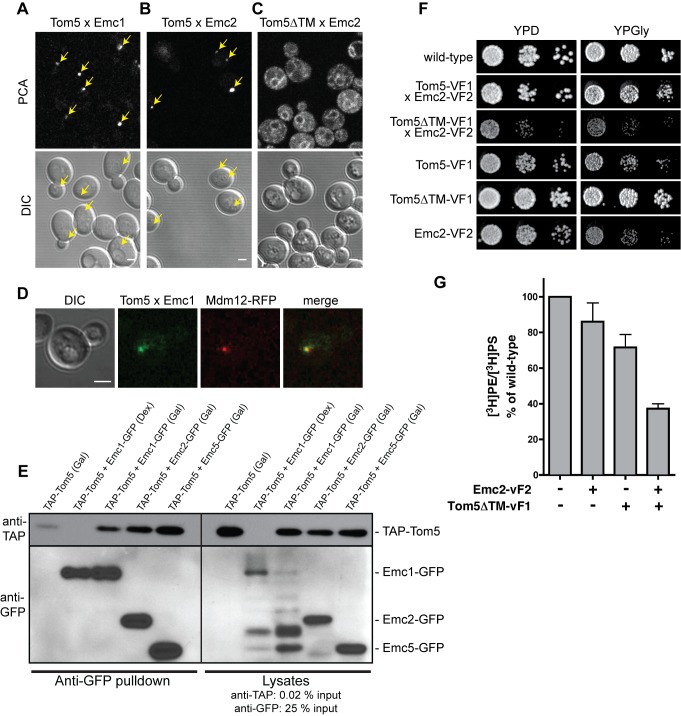
Mitochondrial membrane biogenesis and lipid metabolism require phospholipid transfer from the endoplasmic reticulum (ER) to mitochondria. Transfer is thought to occur at regions of close contact of these organelles and to be nonvesicular, but the mechanism is not known. Here we used a novel genetic screen in S. cerevisiae to identify mutants with defects in lipid exchange between the ER and mitochondria. We show that a strain missing multiple components of the conserved ER membrane protein complex (EMC) has decreased phosphatidylserine (PS) transfer from the ER to mitochondria. Mitochondria from this strain have significantly reduced levels of PS and its derivative phosphatidylethanolamine (PE). Cells lacking EMC proteins and the ER-mitochondria tethering complex called ERMES (the ER-mitochondria encounter structure) are inviable, suggesting that the EMC also functions as a tether. These defects are corrected by expression of an engineered ER-mitochondrial tethering protein that artificially tethers the ER to mitochondria. EMC mutants have a significant reduction in the amount of ER tethered to mitochondria even though ERMES remained intact in these mutants, suggesting that the EMC performs an additional tethering function to ERMES. We find that all Emc proteins interact with the mitochondrial translocase of the outer membrane (TOM) complex protein Tom5 and this interaction is important for PS transfer and cell growth, suggesting that the EMC forms a tether by associating with the TOM complex. Together, our findings support that the EMC tethers ER to mitochondria, which is required for phospholipid synthesis and cell growth.


Conflict of interest statement

The authors have declared that no competing interests exist.

Figures

Figure 1
Figure 1. Genome-wide screen for regulators of phospholipid synthesis.
(A) Phospholipid synthesis in the methylation pathway is compartmentalized between ER and mitochondria. PS synthesized in the ER is transferred to mitochondria for conversion into PE and transported back to the ER for conversion to PC. The Kennedy pathway synthesizes PE and PC from ethanolamine (etn) and choline (cho) independent of lipid transfer between ER and mitochondria. (B) Yeast growth assays for the indicated mutants in the absence (nil) or presence of ethanolamine (+ etn) or choline (+ cho). (C) Results of SGA screen for CHO2 in the absence (–) and presence (+) of choline. Genetic interactions are plotted as the log2 of the ratio of growth of single versus double mutants with Δcho2 in the absence and presence of choline. Interactions rescued by choline (green triangles) predominately clustered on the x axis, whereas interactions not rescued (red squares) were present on the diagonal. (D) Enrichment of functional groups for the genes that showed interactions and were rescued by choline in (C). Fold enrichment represents the frequency of a given term in our dataset relative to the frequency of that term in the whole genome.
Figure 2
Figure 2. EMC genes function in phospholipid metabolism.
(A) Genetic interactions identified between EMC genes and CHO2. Plotted is the ratio of spot size of the single EMC mutants versus the corresponding double mutants with Δcho2 in the absence and presence of choline. The data used to generate this graph are in Table S1. (B) EMC gene cluster identified in the global genetic interaction map and aggravating genetic interactions with a cluster of genes that function in the methylation pathway of phospholipid synthesis. Aggravating interactions have negative values, and alleviating interactions have positive values. Trees identify isolated clusters identified in the global genetic interaction map. The data used to generate this figure have been published . (C) Functional map for EMC6 derived using genetic interactions identified in the EMC6 SGA screen. Colored nodes represent functional groups, and edges define associations between groups. Node size and edge thickness indicate their level of significance within the network. Genes (grey nodes) identified in the screen that are associated with each functional group are shown (blue edges).
Figure 3
Figure 3. EMC proteins form a complex in the ER.
(A) Yeast expressing EMC proteins endogenously tagged with GFP imaged by confocal microscopy; top panel, fluorescence image; bottom panel, DIC. (B) Interactions between EMC proteins in the ER imaged using Venus PCA. Images of cells expressing proteins fused to either of the two halves of the Venus proteins (VF1 or VF2). Scale bars, 2 µm.
Figure 4
Figure 4. Cells missing multiple EMC proteins have defects in PS transfer from the ER to mitochondria.
(A) Cells with the indicated genotypes were labeled with [3H]serine for 30 min and the ratio of [3H]PS converted to [3H]PE determined (mean ±s.d., n = 3–5 independent experiments). The dashed red line indicates the amount of conversion that occurred in psd1Δ cells. * p<0.05 compared to wild-type, independent two-tailed t test. (B) The 10-fold serial dilutions of cultures of the indicated strains were spotted onto SC medium with or without 5-FOA and ethanolamine. The plates were incubated at 30°C for 4 d. (C) PSD activity of crude mitochondria incubated with NBD-PS for 1 h at 30°C. PSD activity was normalized to that of wild-type crude-mitochondria (mean ±s.d., n = 2–3 independent experiments). * p<0.05 compared to wild-type, independent two-tailed t test. The data used to generate panels A and C are in Table S4.
Figure 5
Figure 5. Mitochondria from cells missing Emc proteins have reduced levels of PS and PE and are not functional.
(A) Wild-type and 5x-emc cells were grown for at least three generations in medium containing [3H]acetate, and the amount of the six major phospholipids in purified mitochondria was determined (mean ±s.d., n = 3 independent experiments). * p<0.05, independent two-tailed t test. The data used to generate this graph are in Table S5. (B) The 10-fold serial dilutions of the indicated strains on YPD and YPGly plates. The plates were incubated at 30°C for 3 d.
Figure 6
Figure 6. 5x-emc mmm1-1 cells are not viable and have a dramatic reduction in ER to mitochondria PS transfer at nonpermissive temperature.
(A) Crude mitochondria were incubated with [3H]serine and Mn2+. After 20 min at 30°C, EDTA and an excess of unlabeled serine were added; chelation of Mn2+ by EDTA inhibits PS synthase and allows Psd1 to function. The samples were collected over 15 min, and the rate of [3H]PS to [3H]PE conversion per minute was calculated (mean ±s.d., n = 3–5 independent experiments). * p<0.05 compared to wild-type, two-tailed t test. (B) The rate of PS to PE conversion of strains expressing ChiMERA was determined as in (A) (mean ±s.d., n = 3 independent experiments). The data used to generate panels A and B are in Table S6. (C) Cultures of strains with the indicated genotypes were grown at 23°C and 10-fold serial dilutions were spotted on to YPD plates and incubated at 23°C or 37°C for 4 d.
Figure 7
Figure 7. Cells lacking the EMC or the ERMES complex have reduced ER-mitochondria contacts.
(A) Mitochondria were purified from the indicated strains and the percent of the ER proteins Dpm1 or Kar2 and the mitochondrial protein Por1 determined (mean ±s.d., n = 3 independent experiments). (B) Representative EM image shows a portion of a wild-type cell (top left). The same image is shown with reduced contrast (top right) to indicate the length of ER to mitochondria contact, highlighted with red lines. EM images showing portions of mutant cells are shown in the middle panels. Red arrows indicate a contact between the ER and mitochondria (M), and the blue arrows show a contact between the ER and the plasma membrane (PM). The bottom panels show the average ER–mitochondria ratio and average length of contacts (mean ±s.d., n = 15 individual cells). The ER–mitochondria ratio was determined by measuring the length of contacts between the ER and mitochondria divided by the length of mitochondrial perimeter in each image. * p<0.05, ** p<0.005 compared to wild-type, independent two-tailed t test. The data used to generate the graphs are in Table S7.
Figure 8
Figure 8. Formation of ERMES complex is not altered in 5x-emc cells.
(A) Images of wild-type, 5x-emc, or mdm10D cells expressing Mmm1–GFP on the chromosome. Scale bar, 1 µm. (B) Number of puncta per cell in the indicated strains (mean ±s.d., n = 80 cells). (C) Average intensity of puncta in the indicated strains (mean ±s.d., n = 80 cells). * p<0.05 compared to wild-type, independent two-tailed t test. The data used to generate panels B and C are in Table S8.
Figure 9
Figure 9. The EMC interacts with Tom5 at ER-mitochondria contacts.
(A and B) Interactions between Tom5 and Emc1 (A) and Emc2 (B) proteins imaged by Venus PCA. (C) Interaction between Tom5ΔTM and Emc2 by PCA. (D) Colocalization of the Tom5–Emc interaction and Mdm12–RFP of the ERMES complex. (E) Coimmunoprecipitation of TAP–Tom5 and Emc1p, Emc2p, or Emc5p fused to GFP. Expression of TAP–Tom5 was induced in medium containing galactose (Gal) and repressed in medium with glucose (Dex). (F) Yeast growth assays for the indicated strains on media containing glucose (YPD) or glycerol (YPGly). Tom5 × Emc2 and Tom5ΔTM × Emc2 indicate haploid strains used for PCA containing Tom5 tagged with VF1 and Emc2 tagged with VF2. (G) Cells with the indicated genotypes were labeled with [3H]serine as in Figure 4A. The ratio of [3H]PS converted to [3H]PE was determined and expressed as a percent of wild-type cells (mean ±s.d., n = 3 independent experiments). * p<0.05 compared to wild-type, independent two-tailed t test. All scale bars, 2 µm. The data used to generate this graph are in Table S9.

Similar articles

Cited by

References

    1. Prinz WA (2010) Lipid trafficking sans vesicles: where, why, how? Cell 143: 870–874. - PMC - PubMed
    1. Osman C, Voelker DR, Langer T (2011) Making heads or tails of phospholipids in mitochondria. J Cell Biol 192: 7–16. - PMC - PubMed
    1. Flis VV, Daum G (2013) Lipid transport between the endoplasmic reticulum and mitochondria. Cold Spring Harb Perspect Biol 5. - PMC - PubMed
    1. Toulmay A, Prinz WA (2011) Lipid transfer and signaling at organelle contact sites: the tip of the iceberg. Curr Opin Cell Biol 23: 458–463. - PMC - PubMed
    1. Elbaz Y, Schuldiner M (2011) Staying in touch: the molecular era of organelle contact sites. Trends Biochem Sci 36: 616–623. - PubMed

Publication types

MeSH terms

Substances