. 2014 Oct 14;9(10):e110194.
doi: 10.1371/journal.pone.0110194. eCollection 2014.

Onecut1 and Onecut2 play critical roles in the development of the mouse retina

Affiliations

Onecut1 and Onecut2 play critical roles in the development of the mouse retina

Jillian J Goetz et al. PLoS One. .

Erratum in

  • PLoS One. 2014;9(12):e115786

Abstract

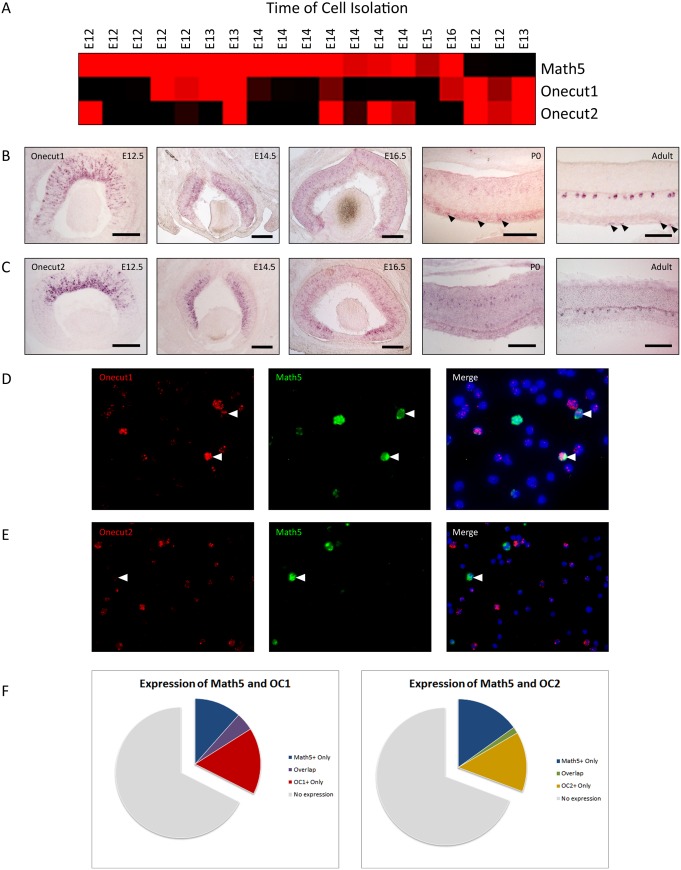
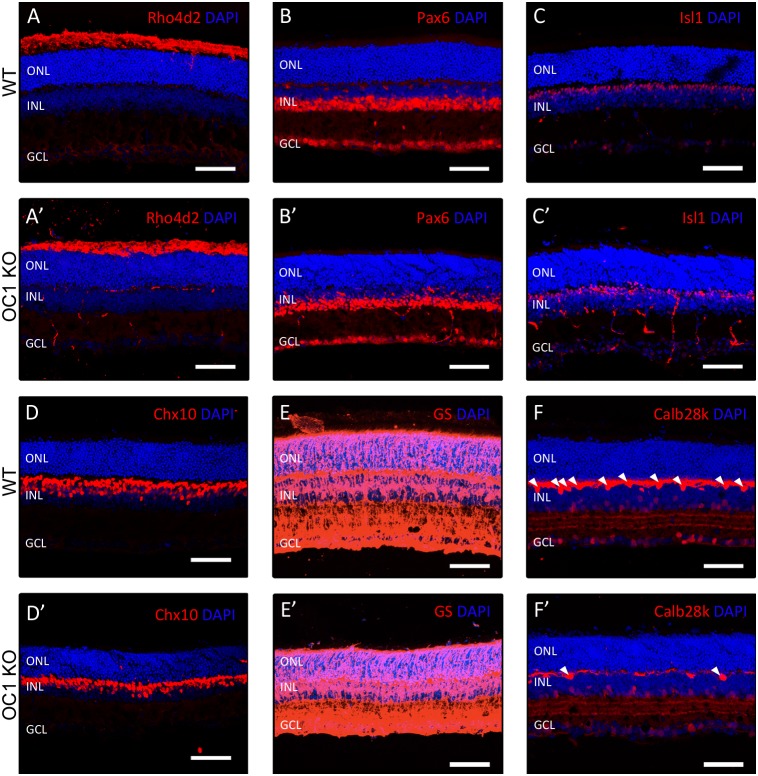
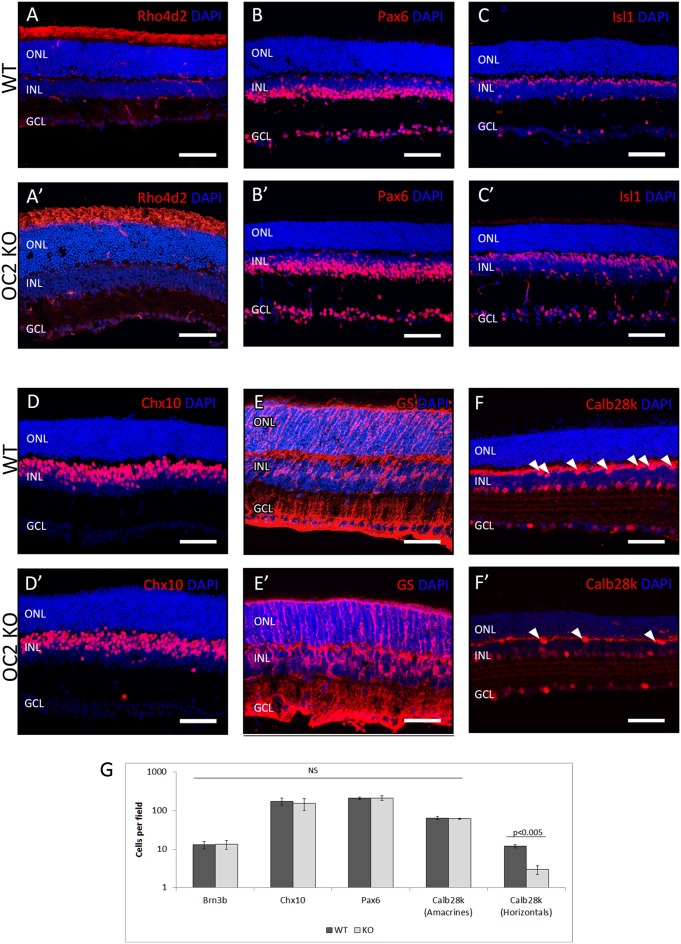
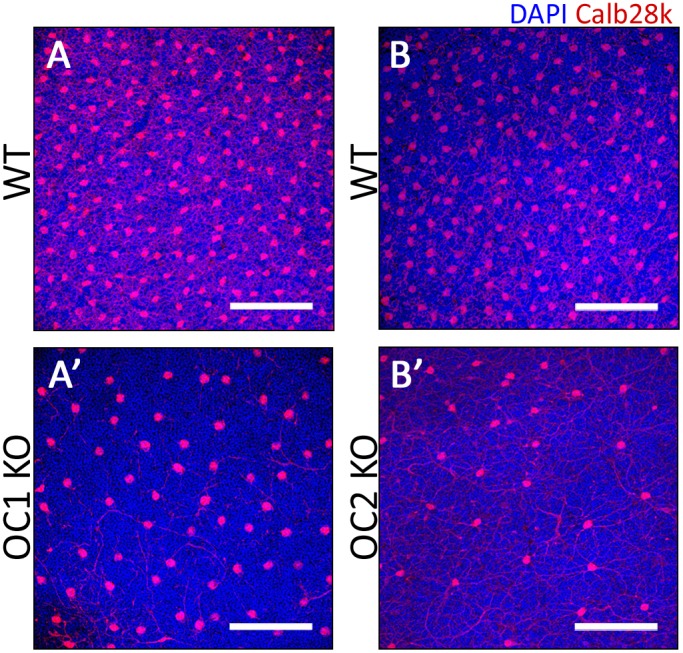
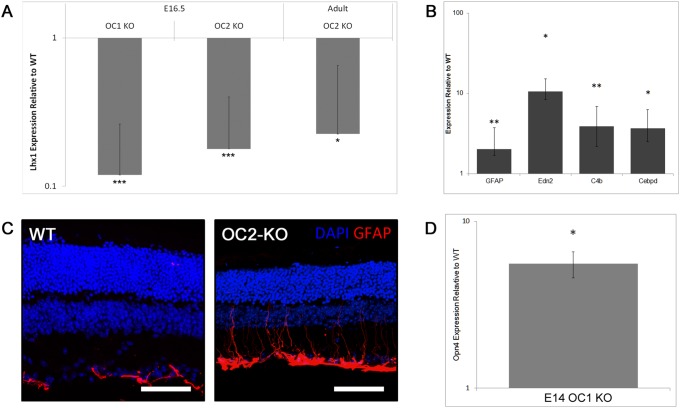
The entire repertoire of intrinsic factors that control the cell fate determination process of specific retinal neurons has yet to be fully identified. Single cell transcriptome profiling experiments of retinal progenitor cells revealed considerable gene expression heterogeneity between individual cells, especially among different classes of transcription factors. In this study, we show that two of those factors, Onecut1 and Onecut2, are expressed during mouse retinal development. Using mice that are deficient for each of these transcription factors, we further demonstrate a significant loss (∼70-80%) of horizontal cells in the absence of either of these proteins, while the other retinal cells appear at normal numbers. Microarray profiling experiments performed on knockout retinas revealed defects in horizontal cell genes as early as E14.5. Additional profiling assays showed an upregulation of several stress response genes in the adult Onecut2 knockout, suggesting that the integrity of the retina is compromised in the absence of normal numbers of horizontal cells. Interestingly, melanopsin, the gene coding for the photopigment found in photosensitive ganglion cells, was observed to be upregulated in Onecut1 deficient retinas, pointing to a possible regulatory role for Onecut1. Taken together, our data show that similar to Onecut1, Onecut2 is also necessary for the formation of normal numbers of horizontal cells in the developing retina.


Conflict of interest statement

Competing Interests: The authors have declared that no competing interests exist.

Figures

Figure 1
Figure 1. Expression of Onecut1 and Onecut2 in the developing murine retina.
The expression of Onecut transcription factors was analyzed throughout retinal development (A). A heatmap indicating the genes (rows) expressed in isolated single retinal progenitor cells (columns) at various stages of development, from embryonic day (E)12.5 to E16.5. Increased expression of a gene in a given cell is indicated in shades of red, while the absence of expression is indicated with a black square. Expression patterns of Onecut1 (B) and Onecut2 (C) mRNAs were determined via in situ hybridization at various stages of retinal development and in the adult retina. Arrowheads indicate expression in the ganglion cell layer. Adult scale bars represent 100 µm; all others 200 µm. (D,E) Dissociated cell in situ hybridization was performed at E14.5 using a probe targeting either Onecut1 or Onecut2 and Math5. Arrowheads indicate overlapping Math5 and Onecut family member expression. (F) Quantification of dissociated retinal cells expressing Math5, Onecut1, and Onecut2.
Figure 2
Figure 2. Immunohistochemistry of Adult OC1 Knockout Retinas.
Changes in mature retinal cell populations resulting from the loss of OC1 were examined using immunohistochemistry. Most retinal populations were unchanged between wildtype and OC1-KO littermates, including rod photoreceptors (A,A’), amacrine cells (B,B’,C,C’), bipolar cells (D,D'), and Muller glia (E,E’). However, anti-Calb28k-staining shows a decrease in horizontal cells in OC1-KO retinas as compared to a wildtype littermate (F,F'). Arrowheads indicate horizontal cell nuclei. Scale bars represent 100 µm.
Figure 3
Figure 3. Immunohistochemistry of Adult OC2 Knockout Retinas.
Changes in mature retinal cell populations resulting from the loss of OC2 were examined using immunohistochemistry. Rod photoreceptors (A,A'), amacrine cells (B,B',C,C'), bipolar cells (D,D'), and Muller glia (E,E') were unchanged, whereas the horizontal cell population was greatly decreased (F,F'; arrowheads indicate horizontal cell bodies). Scale bars represent 100 µm. (G) The results of the immunohistochemical analyses were quantified for identically-sized fields of cryosectioned retinal tissue. Although staining for Brn3b, Chx10, Pax6, and the Calb28k that marks amacrine cell bodies were unchanged, horizontal cell bodies marked by Calb28k were significantly decreased in OC2-KO retinas (n = 3, p<0.005).
Figure 4
Figure 4. Assessment of horizontal cells by flat mount retina staining.
To better understand the distribution of horizontal cell loss in the OC1 and OC2-KO retinas, immunohistochemistry was performed using an anti-Calbindin 28k antibody on age-matched WT (A,B), OC1-KO (A’), and OC2-KO (B’) retinas. Scale bars represent 100 µm.
Figure 5
Figure 5. Examination of early postnatal stages in OC2-KO retinas.
To determine whether this decrease in horizontal cells was confined to the fully mature retina, or was present earlier in development, immunohistochemistry was performed on the early postnatal retina. Age-matched animals were processed for either retinal sections (P5) or flatmounts (P10) and stained with an anti-Rhodopsin antibody (A,A’), an anti-Chx10 antibody (B,B’), or an anti-Calbindin 28k antibody (C,C’,D,D’). Scale bars represent 100 µm.
Figure 6
Figure 6. Unbiased search for changes in the OC2-deficient retina.
(A) Quantitative PCR (qPCR) analyses determining the relative amounts of Lhx1 in OC1-KO, and OC2-KO retinas at E16.5 or adult compared to WT littermate retinas. (B) qPCR determining the relative amounts of various genes identified in models of retinal damage or disease expressed in adult OC2 retinas. Each marker known to be involved in retinal stress is significantly upregulated in OC2 compared to their WT littermates, including GFAP, Edn2, C4b, and Cebpd. (C) WT and OC2-KO retinas were stained with an anti-GFAP antibody. Scale bars represent 100 µm. (D) qPCR determining the relative amounts of Opn4 in E14.5 OC1-KO retinas compared to WT littermate retinas. * indicates p<0.05, ** indicates p<0.01, *** indicates p<0.005. Scale bars represent 100 µm. All quantitative results are plotted on logarithmic scale.

References

    1. Edlund T, Jessell TM (1999) Progression from extrinsic to intrinsic signaling in cell fate specification: a view from the nervous system. Cell 96: 211–224. - PubMed
    1. Goetz JJ, Farris C, Chowdhury R, Trimarchi JM (2014) Making of a Retinal Cell. International Review of Cell and Molecular Biology. Elsevier, Vol. 308: 273–321 Available: http://linkinghub.elsevier.com/retrieve/pii/B9780128000977000075 Accessed 12 May 2014 - PubMed
    1. He J, Zhang G, Almeida AD, Cayouette M, Simons BD, et al. (2012) How Variable Clones Build an Invariant Retina. Neuron 75: 786–798 10.1016/j.neuron.2012.06.033 - DOI - PMC - PubMed
    1. Livesey FJ, Cepko CL (2001) Vertebrate neural cell-fate determination: lessons from the retina. Nat Rev Neurosci 2: 109–118 10.1038/35053522 - DOI - PubMed
    1. Chen Z, Li X, Desplan C (2012) Deterministic or Stochastic Choices in Retinal Neuron Specification. Neuron 75: 739–742 10.1016/j.neuron.2012.08.008 - DOI - PMC - PubMed

Publication types

Associated data