

3'-Phosphoadenosine 5'-phosphosulfate allosterically regulates sulfotransferase turnover
- PMID: 25314023
- PMCID: PMC4230322
- DOI: 10.1021/bi501120p
3'-Phosphoadenosine 5'-phosphosulfate allosterically regulates sulfotransferase turnover
Abstract
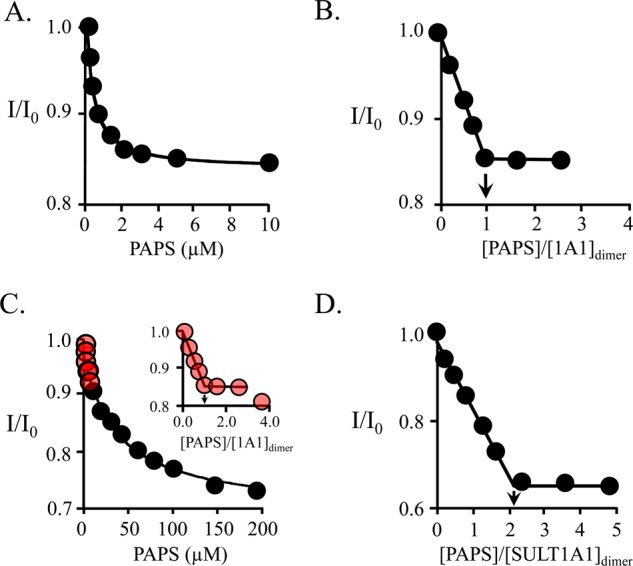
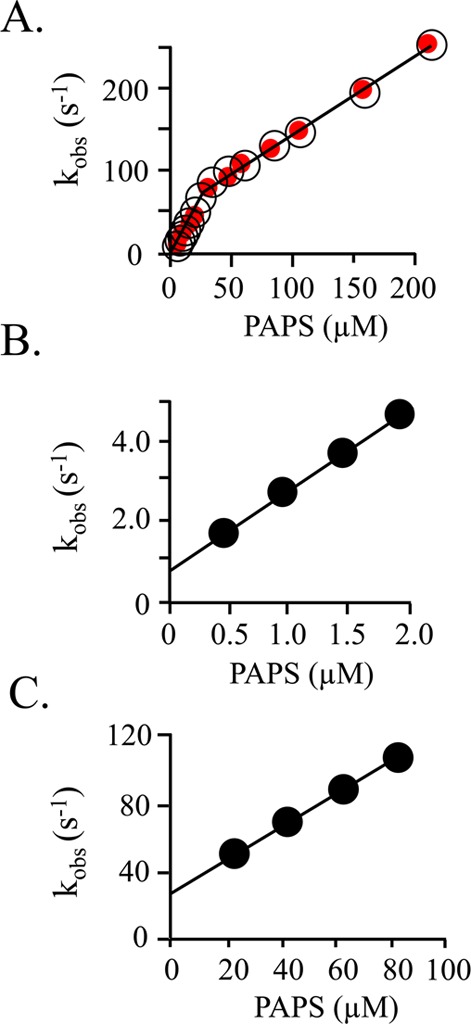
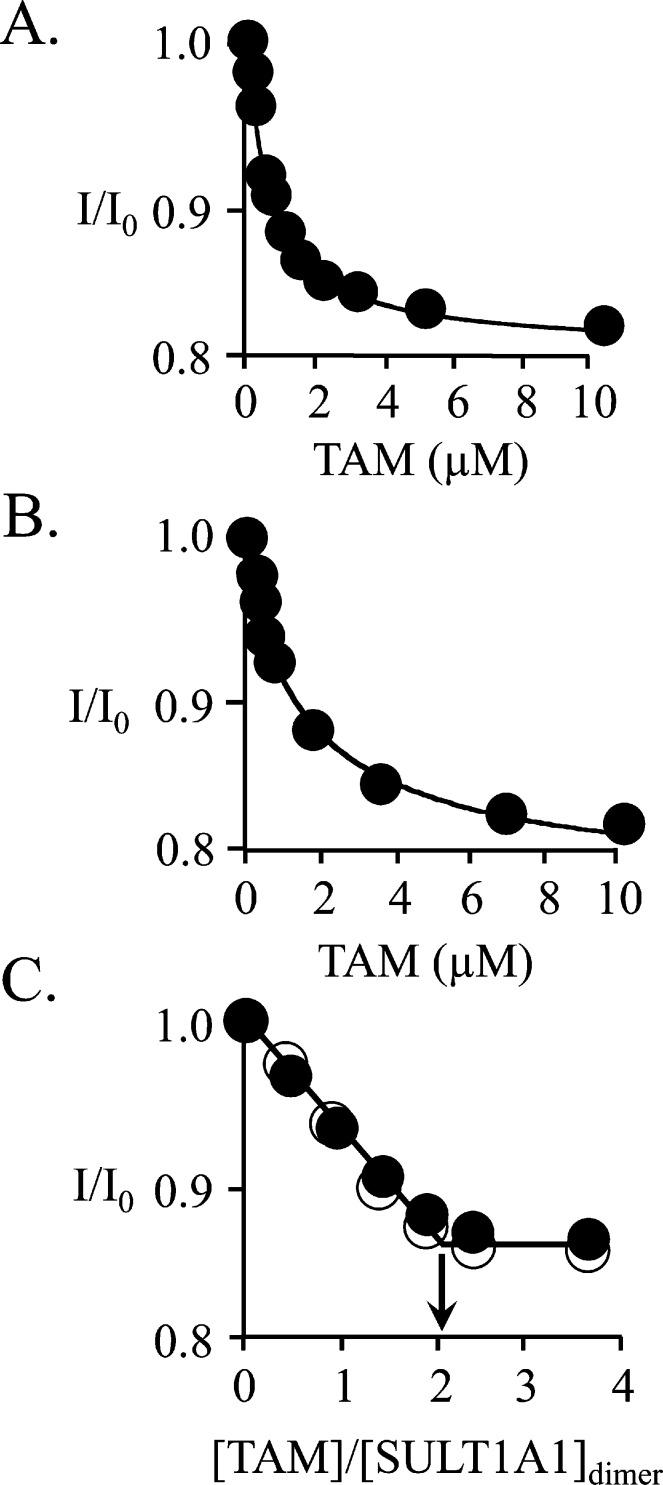
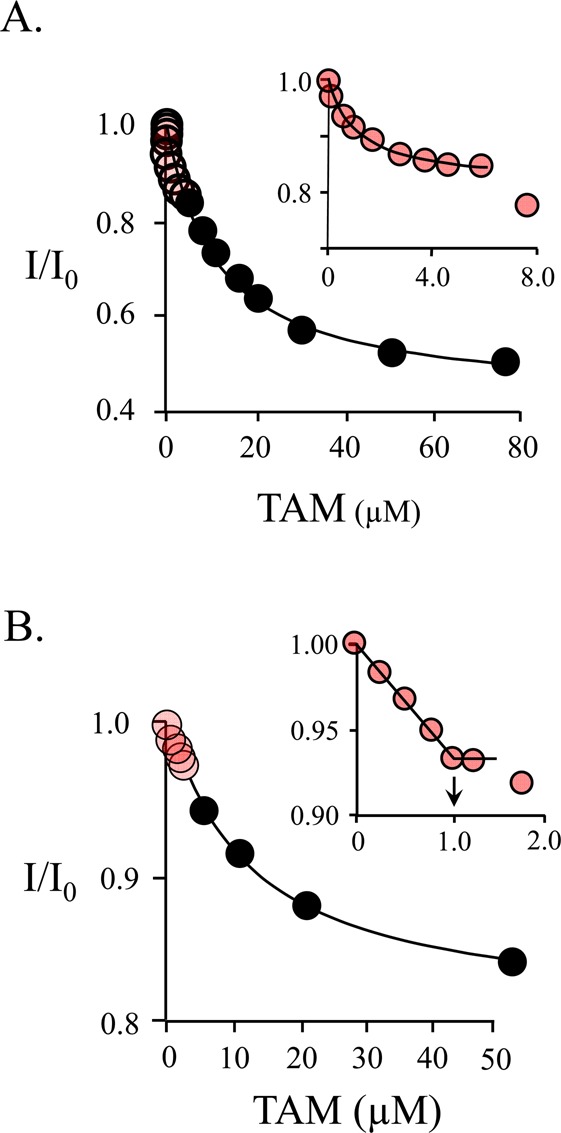
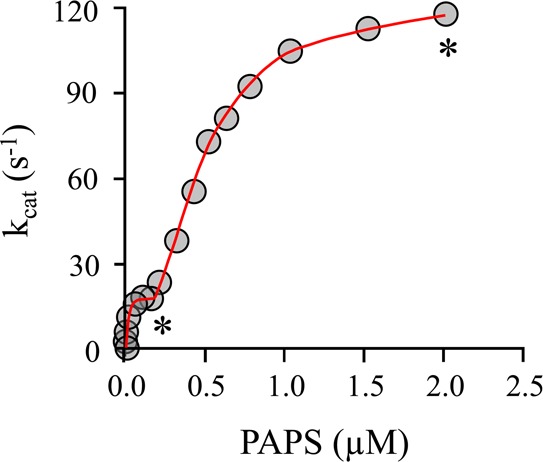
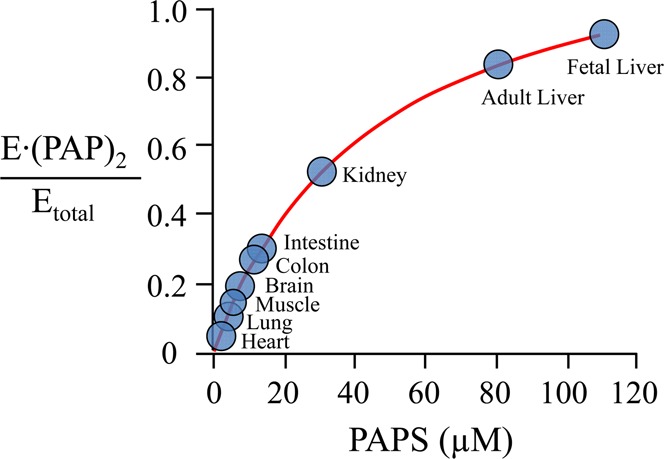
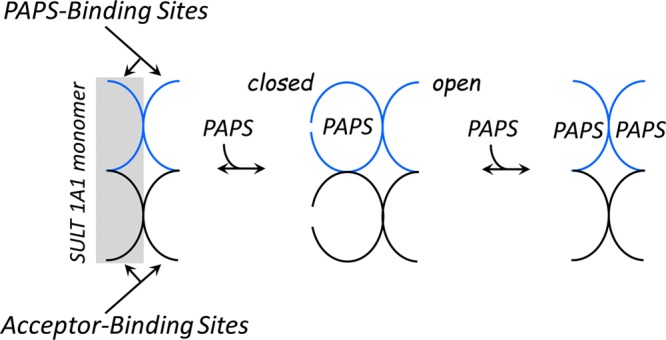
Human cytosolic sulfotransferases (SULTs) regulate the activities of thousands of small molecules-metabolites, drugs, and other xenobiotics-via the transfer of the sulfuryl moiety (-SO3) from 3'-phosphoadenosine 5'-phosphosulfate (PAPS) to the hydroxyls and primary amines of acceptors. SULT1A1 is the most abundant SULT in liver and has the broadest substrate spectrum of any SULT. Here we present the discovery of a new form of SULT1A1 allosteric regulation that modulates the catalytic efficiency of the enzyme over a 130-fold dynamic range. The molecular basis of the regulation is explored in detail and is shown to be rooted in an energetic coupling between the active-site caps of adjacent subunits in the SULT1A1 dimer. The first nucleotide to bind causes closure of the cap to which it is bound and at the same time stabilizes the cap in the adjacent subunit in the open position. Binding of the second nucleotide causes both caps to open. Cap closure sterically controls active-site access of the nucleotide and acceptor; consequently, the structural changes in the cap that occur as a function of nucleotide occupancy lead to changes in the substrate affinities and turnover of the enzyme. PAPS levels in tissues from a variety of organs suggest that the catalytic efficiency of the enzyme varies across tissues over the full 130-fold range and that efficiency is greatest in those tissues that experience the greatest xenobiotic "load".
Figures
Similar articles
-
Sulfotransferase 1A1 Substrate Selectivity: A Molecular Clamp Mechanism.Biochemistry. 2015 Oct 6;54(39):6114-22. doi: 10.1021/acs.biochem.5b00406. Biochemistry. 2015. PMID: 26340710 Free PMC article.
-
Isozyme Specific Allosteric Regulation of Human Sulfotransferase 1A1.Biochemistry. 2016 Jul 26;55(29):4036-46. doi: 10.1021/acs.biochem.6b00401. Epub 2016 Jul 13. Biochemistry. 2016. PMID: 27356022 Free PMC article.
-
Design and Interpretation of Human Sulfotransferase 1A1 Assays.Drug Metab Dispos. 2016 Apr;44(4):481-4. doi: 10.1124/dmd.115.068205. Epub 2015 Dec 9. Drug Metab Dispos. 2016. PMID: 26658224 Free PMC article. Review.
-
The gate that governs sulfotransferase selectivity.Biochemistry. 2013 Jan 15;52(2):415-24. doi: 10.1021/bi301492j. Epub 2012 Dec 28. Biochemistry. 2013. PMID: 23256751 Free PMC article.
-
Structure, dynamics and selectivity in the sulfotransferase family.Drug Metab Rev. 2013 Nov;45(4):423-30. doi: 10.3109/03602532.2013.835625. Epub 2013 Sep 11. Drug Metab Rev. 2013. PMID: 24025091 Free PMC article. Review.
Cited by
-
Tetrahydrobiopterin regulates monoamine neurotransmitter sulfonation.Proc Natl Acad Sci U S A. 2017 Jul 3;114(27):E5317-E5324. doi: 10.1073/pnas.1704500114. Epub 2017 Jun 19. Proc Natl Acad Sci U S A. 2017. PMID: 28630292 Free PMC article.
-
Sulfotransferase 1A1 Substrate Selectivity: A Molecular Clamp Mechanism.Biochemistry. 2015 Oct 6;54(39):6114-22. doi: 10.1021/acs.biochem.5b00406. Biochemistry. 2015. PMID: 26340710 Free PMC article.
-
Expression, purification and characterization of human cytosolic sulfotransferase (SULT) 1C4.Horm Mol Biol Clin Investig. 2017 Jan 1;29(1):27-36. doi: 10.1515/hmbci-2016-0053. Horm Mol Biol Clin Investig. 2017. PMID: 28222028 Free PMC article.
-
Human DHEA sulfation requires direct interaction between PAPS synthase 2 and DHEA sulfotransferase SULT2A1.J Biol Chem. 2018 Jun 22;293(25):9724-9735. doi: 10.1074/jbc.RA118.002248. Epub 2018 May 9. J Biol Chem. 2018. PMID: 29743239 Free PMC article.
-
The NSAID allosteric site of human cytosolic sulfotransferases.J Biol Chem. 2017 Dec 8;292(49):20305-20312. doi: 10.1074/jbc.M117.817387. Epub 2017 Oct 16. J Biol Chem. 2017. PMID: 29038294 Free PMC article.
References
-
- Falany J. L.; Macrina N.; Falany C. N. (2002) Regulation of MCF-7 breast cancer cell growth by β-estradiol sulfation. Breast Cancer Res. Treat. 74, 167–176. - PubMed
-
- Falany J. L.; Falany C. N. (1996) Regulation of estrogen sulfotransferase in human endometrial adenocarcinoma cells by progesterone. Endocrinology 137, 1395–1401. - PubMed
-
- Steventon G. B.; Heafield M. T.; Waring R. H.; Williams A. C. (1989) Xenobiotic metabolism in Parkinson’s disease. Neurology 39, 883–887. - PubMed
-
- Li L.; Falany C. N. (2007) Elevated hepatic SULT1E1 activity in mouse models of cystic fibrosis alters the regulation of estrogen responsive proteins. J. Cystic Fibrosis 6, 23–30. - PubMed
-
- Moore K. L. (2003) The biology and enzymology of protein tyrosine O-sulfation. J. Biol. Chem. 278, 24243–24246. - PubMed
Publication types
MeSH terms
Substances
Grants and funding
LinkOut - more resources
Full Text Sources
Other Literature Sources
Miscellaneous
