. 2014 Oct 14;9(10):e109768.
doi: 10.1371/journal.pone.0109768. eCollection 2014.

Neurologic abnormalities in mouse models of the lysosomal storage disorders mucolipidosis II and mucolipidosis III γ

Affiliations

Neurologic abnormalities in mouse models of the lysosomal storage disorders mucolipidosis II and mucolipidosis III γ

Rachel A Idol et al. PLoS One. .

Erratum in

  • PLoS One. 2014;9(11):e114199

Abstract

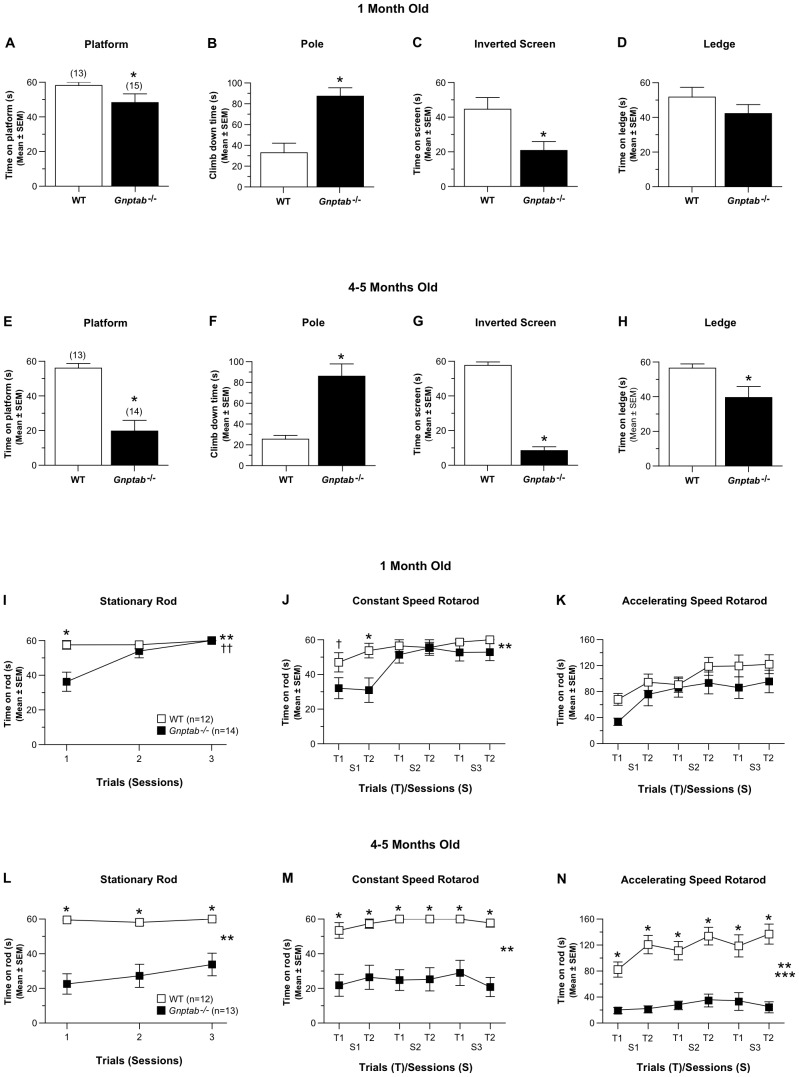
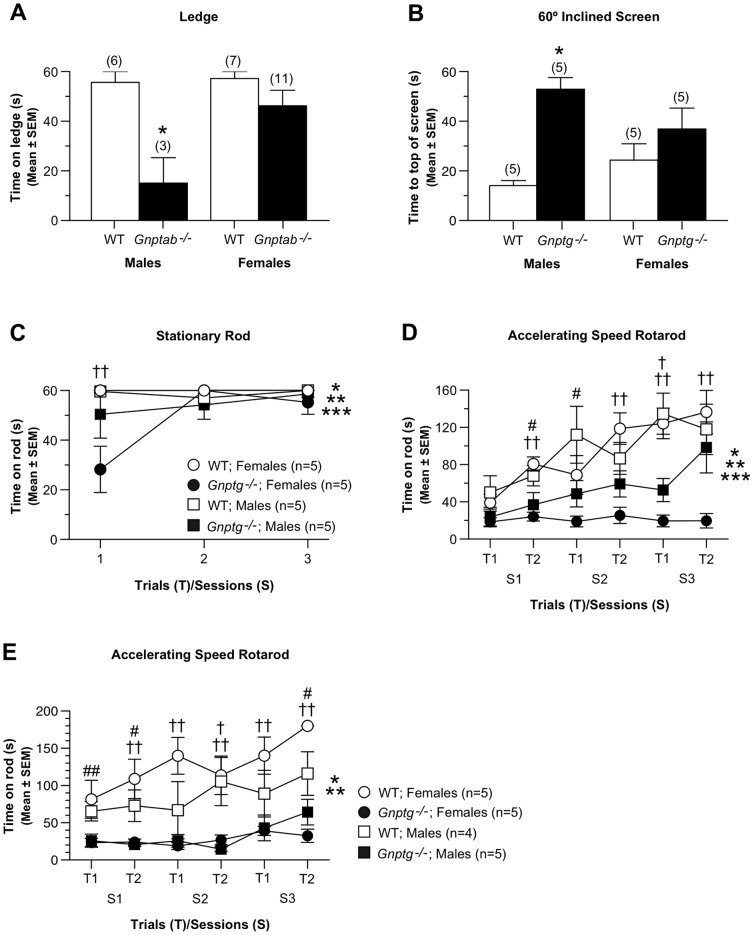
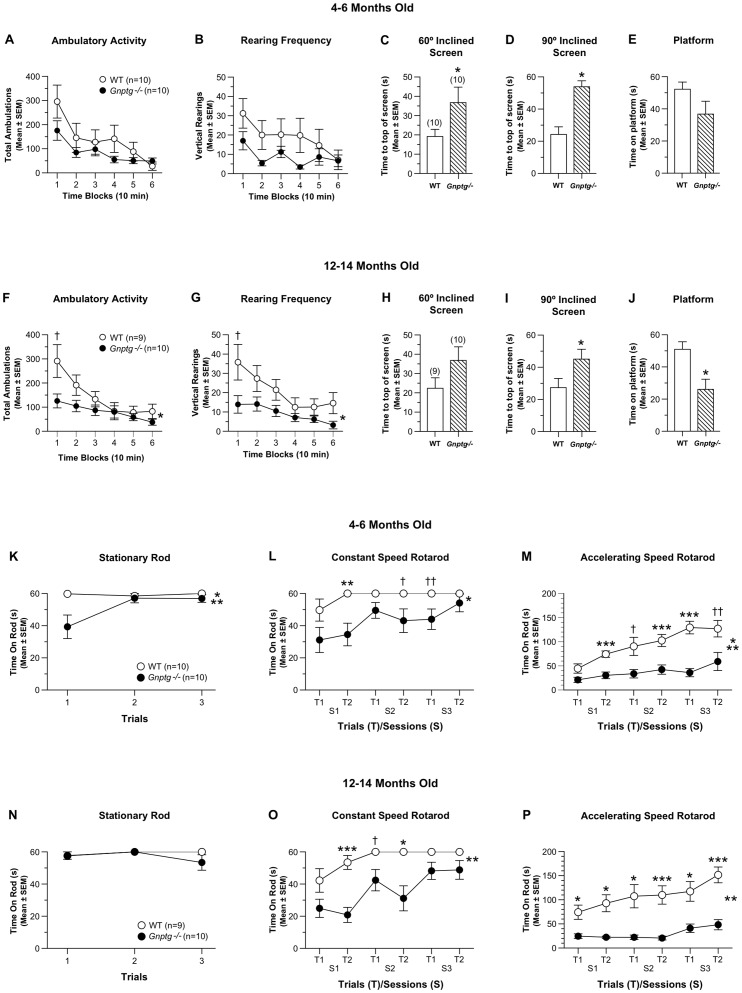
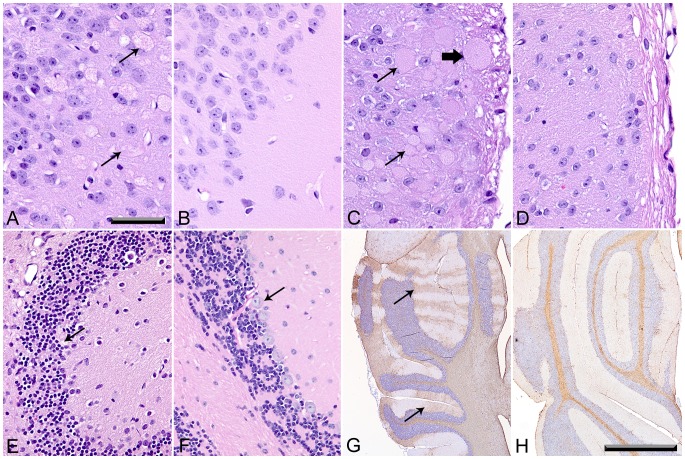
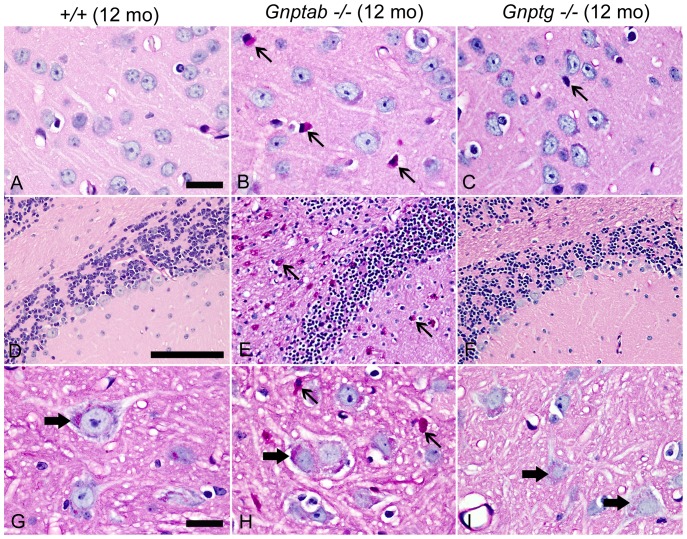
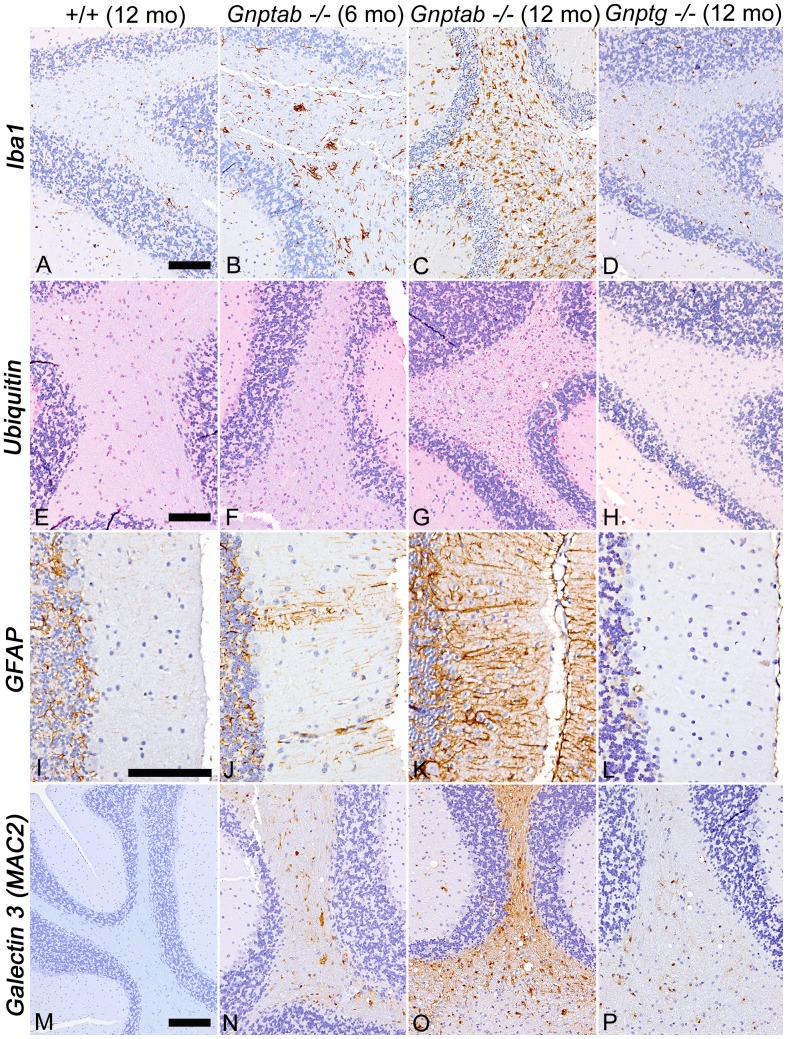
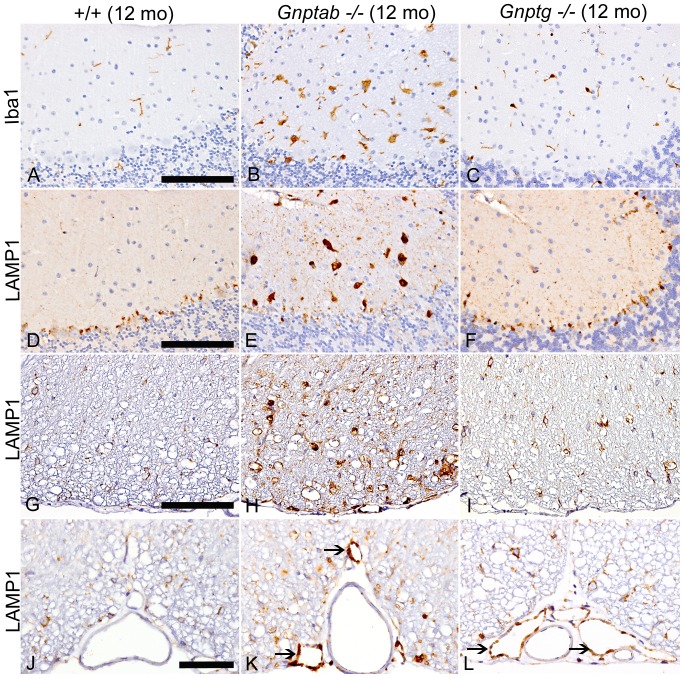
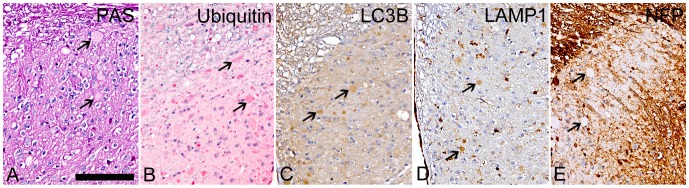
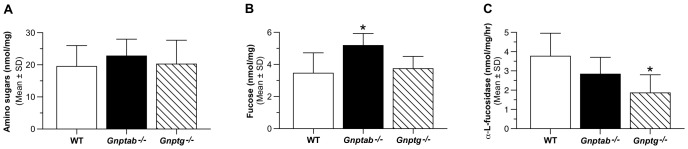
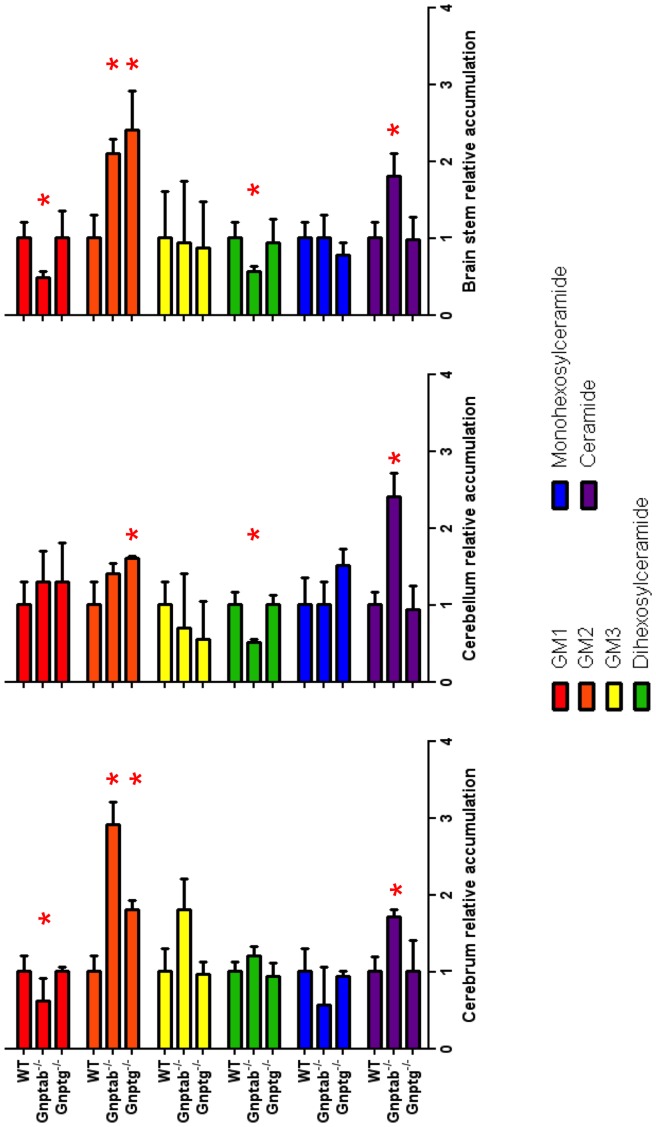
UDP-GlcNAc:lysosomal enzyme N-acetylglucosamine-1-phosphotransferase is an α2β2γ2 hexameric enzyme that catalyzes the synthesis of the mannose 6-phosphate targeting signal on lysosomal hydrolases. Mutations in the α/β subunit precursor gene cause the severe lysosomal storage disorder mucolipidosis II (ML II) or the more moderate mucolipidosis III alpha/beta (ML III α/β), while mutations in the γ subunit gene cause the mildest disorder, mucolipidosis III gamma (ML III γ). Here we report neurologic consequences of mouse models of ML II and ML III γ. The ML II mice have a total loss of acid hydrolase phosphorylation, which results in depletion of acid hydrolases in mesenchymal-derived cells. The ML III γ mice retain partial phosphorylation. However, in both cases, total brain extracts have normal or near normal activity of many acid hydrolases reflecting mannose 6-phosphate-independent lysosomal targeting pathways. While behavioral deficits occur in both models, the onset of these changes occurs sooner and the severity is greater in the ML II mice. The ML II mice undergo progressive neurodegeneration with neuronal loss, astrocytosis, microgliosis and Purkinje cell depletion which was evident at 4 months whereas ML III γ mice have only mild to moderate astrocytosis and microgliosis at 12 months. Both models accumulate the ganglioside GM2, but only ML II mice accumulate fucosylated glycans. We conclude that in spite of active mannose 6-phosphate-independent targeting pathways in the brain, there are cell types that require at least partial phosphorylation function to avoid lysosomal dysfunction and the associated neurodegeneration and behavioral impairments.


Conflict of interest statement

Competing Interests: The authors have declared that no competing interests exist.

Figures

Figure 1
Figure 1. Gnptab−/− mice exhibit performance deficits on sensorimotor and rotarod tests which show progressive impairment with age.
(A–D) At 1-month of age, the Gnptab−/− mice spent significantly (*p = 0.026) less time on an elevated platform (A), took significantly (*p  =  0.0007) longer to climb down a pole (B), and spent significantly (*p  =  0.020) less time hanging upside down on an inverted screen (C) compared to WT littermate control mice. The Gnptab−/− mice also showed a nonsignificant trend in terms of spending less time on an elevated ledge (D). (E-H) Larger performance deficits were observed when the mice were tested at 4-5 months of age when significant impairment was observed in the Gnptab−/− group compared to WT controls on the platform (E; *p  =  0.0002), pole (F; *p  =  0.0005), inverted screen (G; *p <0.00005), and ledge (H; *p  =  0.001) tests (see Fig. 3A for details of sex effects on the ledge test). (I-K) The Gnptab−/− mice demonstrated mild performance impairments on the rotarod when they were tested at 1-month of age. (I) For example, the Gnptab−/− mice spent significantly less time on the stationary rod component of the test compared to the WT group (genotype effect, ††p  =  0.002); genotype x trials interaction (**p  =  0.0004), but this was mostly due to differences observed on trial 1 (*p  =  0.0007). (J) Analysis of the constant speed rotarod data showed that large differences were observed between the Gnptab−/− and WT groups but only during the first session (genotype x sessions interaction; **p  =  0.024); trial 1 (†p  =  0.046); trial 2 (*p  =  0.022). (K) No significant effects involving Genotype were found as a result of analyzing the accelerating rotarod data. (L-M) The Gnptab−/− mice showed severely impaired performance on the rotarod tasks when tested at 4–5 months of age. Specifically, the Gnptab−/− mice were significantly impaired on the stationary rod (L; genotype effect: **p <0.00005; pairwise comparisons for each trial: *p <0.0005), the constant speed rotarod (M; genotype effect: **p <0.00005; pairwise comparisons for each trial: *p <0.003), and accelerating rotarod (N; genotype effect: ***p <0.00005; genotype x trials interaction: **p <0.010; pairwise comparisons for each trial: *p <0.003).
Figure 2
Figure 2. Sex effects on behavior in Gnptab−/− and Gnptg−/− mice.
(A) In addition to a significant genotype effect, an ANOVA conducted on the ledge data from the Gnptab−/− and WT control mice at 1 month of age revealed a significant sex effect (p  =  0.025) and a genotype x sex interaction (p  =  0.041). Subsequent contrasts showed that male Gnptab−/− mice were significantly impaired on the ledge test compared to the male WT mice [F(1,23)  =  12.98, *p  =  0.002], while differences were not significant between the female groups. (B) Analysis of the 60° inclined screen data from the 4-6 month old Gnptg−/− mice showed a significant genotype x sex interaction (p  =  0.041) in addition to the significant genotype effect, suggesting that impaired performance may have varied differentially as a function of sex in each group. Additional contrasts documented that the male Gnptg−/− mice took significantly longer to reach the top of the apparatus compared to the males from the WT group [F(1,16)  =  21.51, *p  =  0.0003), while the performance of the females from the two groups did not differ significantly. (C) An rmANOVA on the stationary rod data from testing the Gnptg−/− and control mice at 4–6 months of age revealed a significant sex x trials interaction, (**p  =  0.030) as well as a significant (*) genotype effect and a significant (***) genotype x trials interaction, suggesting that differences in performance were dependent on trials and sex. Additional contrasts showed that the performance of the male groups of mice did not differ across the stationary rod trials, although the female Gnptg−/− mice were significantly impaired compared to the WT controls, [F(1,16)  =  6.72, p  =  0.020), with significant differences being observed on the first trial (††p  =  0.004). (D) Robust performance impairments in the Gnptg−/− mice at 4-6 months of age were observed during the accelerating rotarod test where an rmANOVA yielded a significant genotype x sex x trials interaction, (***p  =  0.004), along with a significant (*) genotype effect and significant (**) genotype x sessions interaction. Subsequent contrasts relating to the sex effect showed that the male Gnptg−/− mice remained on the rod longer than the male control group [F(1,16)  =  5.64, p  =  0.031) with significant differences occurring on session 3 - trial 1 (†p  =  0.002), although large differences were also found for session 1 - trial 2 (#p  =  0.036) and session 2 - trial 1 (#p  =  0.039). Differences were even greater in the female groups whereby the female Gnptg−/− mice performed significantly worse than the control females [F(1,16)  =  17.65, p  =  0.0007), with significant differences being observed for session 1 - trial 2 (††p  =  0.0007), session 2 - trial 2 (††p  =  0.0004), session 3 - trial 1 (††p  =  0.0002), and session 3 - trial 2 (††p  =  0.002). (E) Analysis of the accelerating rotarod data at 12–14 months revealed a significant genotype x gender x trials x sessions interaction, (**p  =  0.017), as well as a significant (*) genotype effect. Additional contrasts related to the sex variable showed that the female Gnptg−/− mice exhibited significantly inferior performance on average across trials and sessions compared to the female WT group [F(1,15)  =  25.37, p  =  0.0001). Pair-wise comparisons revealed significant differences between the female groups on every trial (††p <0.007) except session 1 - trial 1 (##p  =  0.016), where differences were also very large. The performance of the male Gnptg−/− mice was also significantly compromised relative to the male WT controls on average across trials and sessions, although the differences were smaller [F(1,15)  =  6.48, p  =  0.022). Pair-wise comparisons showed that the performance of the male groups differed significantly on session 2 - trial 2 (†p  =  0.006), although large differences were also observed on session 1 - trial 2 (#p  =  0.049), and session 3 - trial 2 (#p  =  0.041).
Figure 3
Figure 3. Gnptg−/− mice show mild to moderate performance deficits on activity, sensorimotor and rotarod tests.
(A-B) Although the Gnptg−/− mice tended to show lower levels of ambulatory activity (A) and vertical rearing frequency (B) relative to WT littermate controls on the 1-h locomotor activity test when tested at 4–6 months of age, no significant effects involving genotype were found following analyses conducted on these data. However the Gnptg−/− group took significantly longer to climb to the top of the 60° (C) and 90° (D) inclined screens, (genotype effects: *p  =  0.0005 and 0.0001, respectively), and showed a nonsignificant trend toward being able to remain on the platform for a shorter time compared to WT control mice (E) when tested at this age (see Fig. 3B for details of sex effects on the 60° inclined screen). (F) When the 1-h activity test was conducted at 12–14 months of age, the Gnptg−/− mice tended to be less active compared to controls, although this depended on the time block of the test session (genotype x time interaction: *p  =  0.012), with the largest group differences being observed during the first time block (†p  =  0.041). (G) At this age, the Gnptg−/− group also showed significantly reduced rearing frequency on average across time blocks, (genotype effect: *p  =  0.043), with the largest differences occurring during the first block (†p  =  0.049). (H) During testing at 12-14 months of age, the performance level of the Gnptg−/− mice tended to be much lower than that of the WT control group on the 60° inclined screen, but the differences were not statistically significant. However, the Gnptg−/− mice did show significant performance deficits at this age on the 90° inclined screen (I) and platform tests (J), (genotype effects: *p  =  0.026 and *p  =  0.010, respectively). The Gnptg−/− strain was also impaired on the rotarod when tested at 4–6 months of age. (K) For example, a significant genotype effect (*p  =  0.024) indicated that the Gnptg−/− mice were impaired on the stationary rod component of the rotarod although this effect was mostly due to differences observed during trial 1 (††p  =  0.007), whereas their performance on the other two trials were similar to those of the WT group (see Fig. 3C for details of sex effects). (L) The Gnptg−/− group also exhibited significant performance impairments on the constant speed rotarod on average across trials and sessions (genotype effect: *p  =  0.005), with group differences being significant for session 1 - trial 2 (**p  =  0.004), while large differences were also observed for session 2 - trial 2 (†p  =  0.044) and session 3 - trial1 (††p  =  0.019). (M) Analysis of the accelerating rotarod data also revealed significant performance deficits on the part of the Gnptg−/− mice (genotype effect: **p  =  0.0003; genotype x sessions interaction: *p  =  0.002), although this was somewhat dependent on the sessions variable. Pair-wise comparisons showed that group performances differed significantly for session 1 - trial 2, session 2 - trial 2, and session 3 - trial 1 (***p <0.0009), while large differences were observed for session 2 - trial 1 (†p  =  0.012) and session 3 - trial 2 (††p  =  0.009). (See Fig. 3D for details concerning sex effects.) When the mice were re-tested at 12-14 months, the groups were found to perform similarly on the stationary rod (N). However, the Gnptg−/− group again showed significant deficits on the constant speed rotarod (O) which was documented by a significant genotype effect (**p  =  0.0003). Pair-wise comparisons showed that the Gnptg−/− mice had significantly reduced times on the rod for session 1 - trial 2 (***p  =  0.0003) and session 2 - trial 2 (*p  =  0.004), with large differences also being found for session 2 - trial1 (†p  =  0.033). (P) The Gnptg−/− group was also significantly impaired again on the accelerating rotarod when re-tested at the later age, (genotype effect: **p  =  0.0001) when pair-wise comparisons showed significant group differences across all trials and sessions (*p <0.008; ***p <0.0005) (see Fig. 3E for details of sex effects).
Figure 4
Figure 4. Histological lesions in H&E stained sections of brain and spinal cord were detected only in Gnptab−/− mice.
(A) Swollen dystrophic axons/neurites in piriform cortex of 12-month-old Gnptab−/− mice, but absent in WT controls (B). (C) Axonal spheroids were present in the afferent nerves (thick arrow) and dystrophic neurites (thin arrows) were concentrated in the superficial laminae of the dorsal horn grey matter of the spinal cord of Gnptab−/− mice, but were entirely absent in the spinal cords of WT controls (D). (E) Cerebellum of 10/12-month-old Gnptab−/− mice with Purkinje cell loss (arrow) not seen in the Purkinje cell layer (arrow) in WT controls (F). (G) Staining for GFAP in cerebellum of 6-month old Gnptab−/− mice showing bilaterally symmetrical parasagittal bands (arrows) of activated Bergmann glial cells that coincided precisely with zones of Purkinje cell loss. (H) Negative GFAP staining of Bergmann's glia was evident in WT mice. (Figures A-F 40X, Bar  =  100 mm; Figures G and H; 4X, Bar  =  1 mm)
Figure 5
Figure 5. CNS tissue stained by the Periodic acid-Schiff method.
(A) The CNS of 12-month-old WT mice lacked PAS-positive macrophages and microglia. (100X; Bar  =  20 mm) (B) 12-month-old Gnptab−/− mice exhibited widely dispersed enlarged PAS-positive microglia/macrophages (thin arrows) throughout most areas of brain and spinal cord. (C) PAS-positive microglia in Gnptg−/− mice were rare and small (thin arrow). (D) PAS-positive cells were absent in the white tracts and molecular layers of the WT cerebellum, abundant (thin arrows) in Gnptab−/− cerebellum (E), and absent in Gnptg−/− cerebellum (F). (G) Some of the larger neurons in brain and spinal cord of 12-month-old WT mice contained perinuclear clusters of very small, sharply defined PAS-positive granules. Age-matched Gnptab−/− mice (H), had markedly increased amounts of paler-staining granular material in the perinuclear cytoplasm of numerous large and medium size neurons (thick arrow) in addition to enlarged microglia/macrophages (thin arrows). The Gnptg−/− mice had low numbers of the pale-pink granular cytoplasmic material (thick arrows) (I).
Figure 6
Figure 6. Cerebellar staining for ionized-calcium binding protein 1 (Iba1), ubiquitin (UBQ), glial fibrillary acidic protein (GFAP), and galectin-3 (MAC2) to detect microglia, ubiquinated proteins, astrocytes, and inflammation respectively.
(A-D), IHC staining for Iba1 showed small microglia with delicate cytoplasmic extensions in 12 month old WT tissue (A), diffuse reactive microgliosis In 6-month-old Gnptab−/− mice (B), markedly increased staining in 12-month-old Gnptab−/− mice (C), and only mild activation of microglia in 12-month-old Gnptg−/− mice (D). (E) Ubiquitin-positive granules were rarely detected in cerebellar white tracts of 12-month-old WT mice. (F,G) The amount and extent of ubiquitin-positive granules increased in severity between 6 and 12 months of age in Gnptab−/− mice. (H) There was a minimal increase in ubiquitin staining in 12-month-old Gnptg−/− mice. (I-L) IHC staining for GFAP showed faint staining of Bergmann glial cells in 12-month-old WT mice (I), mild multifocal activation of Bergmann glial cells in 6 month old Gnptab−/− mice (J), bilaterally symmetrical areas of Purkinje cell loss with associated thinning of the molecular layer and diffuse activation of Bergmann glia in 12-month-old Gnptab−/− mice (K) and no notable change in GFAP staining patterns involving Bergmann glia in 12-month-old Gnptg−/− mice (L). (M-P) IHC staining of galectin-3 (MAC2) was negative in the CNS tissues of WT mice (M), but showed progressive staining of cerebellar peduncles and white tracts of 6 and 12 month old Gnptab−/− mice (N,O). MAC2 reactivity was mild and mostly restricted to the white tracts and peduncles of the cerebellum in 12 month old Gnptg−/− mice (P). Figures A - H and M - P, 20X; Bar  =  100 mm); Figures I - L, 40X; Bar  =  100 mm).
Figure 7
Figure 7. CNS staining for ionized-calcium binding protein 1 (Iba1) and lysosomal-associated membrane protein1 (LAMP-1).
IHC staining of the cerebellum for Iba1 (A-C) and LAMP-1 (D-F). (A) Molecular layer of cerebellum in 12-month-old WT mice showing nonreactive resident microglia characterized by fine cytoplasmic extensions. (B) In 12-month-old Gnptab−/− mice, there are numerous enlarged Iba1/MAC2 positive macrophages in the molecular layers associated with Purkinje cell loss. (C) In 12-month-old Gnptg−/− mice, there was only mild activation of microglia in the molecular layer. (D) LAMP-1 in 12-month-old WT cerebellum is limited primarily to the Purkinje cell layer. (E) In contrast, LAMP-1 labeling in 12-month-old Gnptab−/− mice is prominent in the enlarged macrophages/microglia in the molecular layer but reduced in the areas of Purkinje cell loss. (F) There was a slightly increased amount of LAMP-1 staining in the Purkinje cell and molecular layers of 12-month-old Gnptg−/− mice, suggesting a subclinical increase in lysosomal storage in these areas. In (G-I) similar genotype-related differences in LAMP-1 staining are shown in spinal cord white tracts in 12-month-old WT, Gnptab−/− and Gnptg−/− mice, respectively. In all genotypes LAMP-1 was detected within oligodendrocytes, but the extent of labeling was markedly increased in Gnptab−/− mice (H) due to increased volume of cytoplasm and extensions of hypertrophic oligodendrocytes, as well as reactive microglia and macrophages. (I) In 12-month-old Gnptg−/− mice, LAMP-1-positive oligodendrocytes are also larger and more prominent than in WT mice, but microglia/macrophages are uncommon. (J-L) Endothelial cells in meningeal veins in WT mice were consistently LAMP-1 negative (J), but microvesiculated endothelium of meningeal veins (not arteries) in both Gnptab−/− (K) and Gnptg−/− (L) mice was LAMP-1 positive, although markedly more so in the Gnptab−/− mice. (Figs. A - I at 40X,Bar  =  100 mm; Figs. J - L at 60X, Bar  =  50 mm)
Figure 8
Figure 8. PAS and IHC staining of brain and spinal cord dystrophic axons and neurites of 12-month-old Gnptab−/− mice.
(A) The dystrophic axons and neurites were consistently negative for PAS (arrows). (B) There was widespread granular staining of most dystrophic axons/neurites for ubiquitin (arrows). In contrast, IHC staining for the autophagy marker LC3B (C) and the lysosome/endosome marker LAMP-1 (D) showed variable (negative to mild) staining of dystrophic axons/neurites (arrows). (E) Strong staining for neurofilament protein (NFP) was present in only a few dystrophic axons in the white tracts of the cerebellum and spinal cord of Gnptab−/− mice, while the abundant large swollen neurites in the superficial laminae (layers 1 to 3) of the dorsal horn grey matter were consistently NFP-negative (arrows). (40X; Bar  =  100 mm)
Figure 9
Figure 9. Gnptab−/− mice have an accumulation of fucosylated oligosaccharides in the brain.
One-year-old WT, Gnptab−/− or Gnptg−/− mice were perfused with PBS and CNS material harvested and frozen until analyzed. Levels of amino sugars (A), or fucosylated glycans was determined (B) (data plotted as mean ±SD, n = 3-5, *P<0.05). (C) Six months – 1 year old WT, Gnptab−/− or Gnptg−/− mice were perfused with PBS and whole brain lysates were used to determine the activity of α-L-fucosidase (data plotted as mean ±SD, n = 6-10. All data was analyzed using an unpaired Student's t-test.
Figure 10
Figure 10. Analysis of Gangliosides and other lipids in Gnptab−/− and Gnptg−/− mice brains.
Cerebrum, cerebellum or brain stem was isolated from 12-month-old WT, Gnptab−/− or Gnptg−/− mice and the isolated lipids analyzed by mass spectrometry. Each sample was analyzed in duplicate and normalized to protein content (ng species/mg total protein) with n = 6 mice for WT and n = 3 for Gnptab−/− and Gnptg−/− mice. Ratio of lipid species/mg protein for WT mice was set to 1 (mean ± SD, *p<0.05). Data shown represents the d18∶1, C18∶0 species for GM1, GM2 and GM3. The dihexosylceramide, monohexosylceramide, ceramide data represents the d18∶1, C16∶0 species. All data was analyzed using an unpaired Student's t-test.

References

    1. Braulke T, Raas-Rothschild A, Kornfeld S (2014) I-Cell Disease and Pseudo-Hurler Polydystrophy: Disorders of Lysosomal Enzyme Phosphorylation and Localization. In: Beaudet AL, Vogelstein B, Kinzler KW, Antonarakis SE, Ballabio A et al.., editors. The Online Metabolic and Molecular Bases of Inherited Disease. New York, NY: The McGraw-Hill Companies, Inc.
    1. Qian Y, Lee I, Lee WS, Qian M, Kudo M, et al. (2010) Functions of the alpha, beta, and gamma subunits of UDP-GlcNAc:lysosomal enzyme N-acetylglucosamine-1-phosphotransferase. The Journal of biological chemistry 285: 3360–3370. - PMC - PubMed
    1. Cathey SS, Kudo M, Tiede S, Raas-Rothschild A, Braulke T, et al. (2008) Molecular order in mucolipidosis II and III nomenclature. American journal of medical genetics Part A 146A: 512–513. - PubMed
    1. Cathey SS, Leroy JG, Wood T, Eaves K, Simensen RJ, et al. (2010) Phenotype and genotype in mucolipidoses II and III alpha/beta: a study of 61 probands. Journal of medical genetics 47: 38–48. - PMC - PubMed
    1. Dittmer F, Ulbrich EJ, Hafner A, Schmahl W, Meister T, et al. (1999) Alternative mechanisms for trafficking of lysosomal enzymes in mannose 6-phosphate receptor-deficient mice are cell type-specific. Journal of cell science 112 (Pt 10): 1591–1597. - PubMed

Publication types

MeSH terms

Supplementary concepts

LinkOut - more resources